Modern technology enables easy and cost-effective ways to get insight from electricity use.
With instantly available data, you can make informed decisions and you can solve problems faster.
Measurements, monitoring and data visualization are vital first steps towards optimization of electrical installations.

Our solution enables you to:
- reduce operating cost by seeing when and where electrical energy is being consumed
- capture data during unforeseen fault conditions for analysis
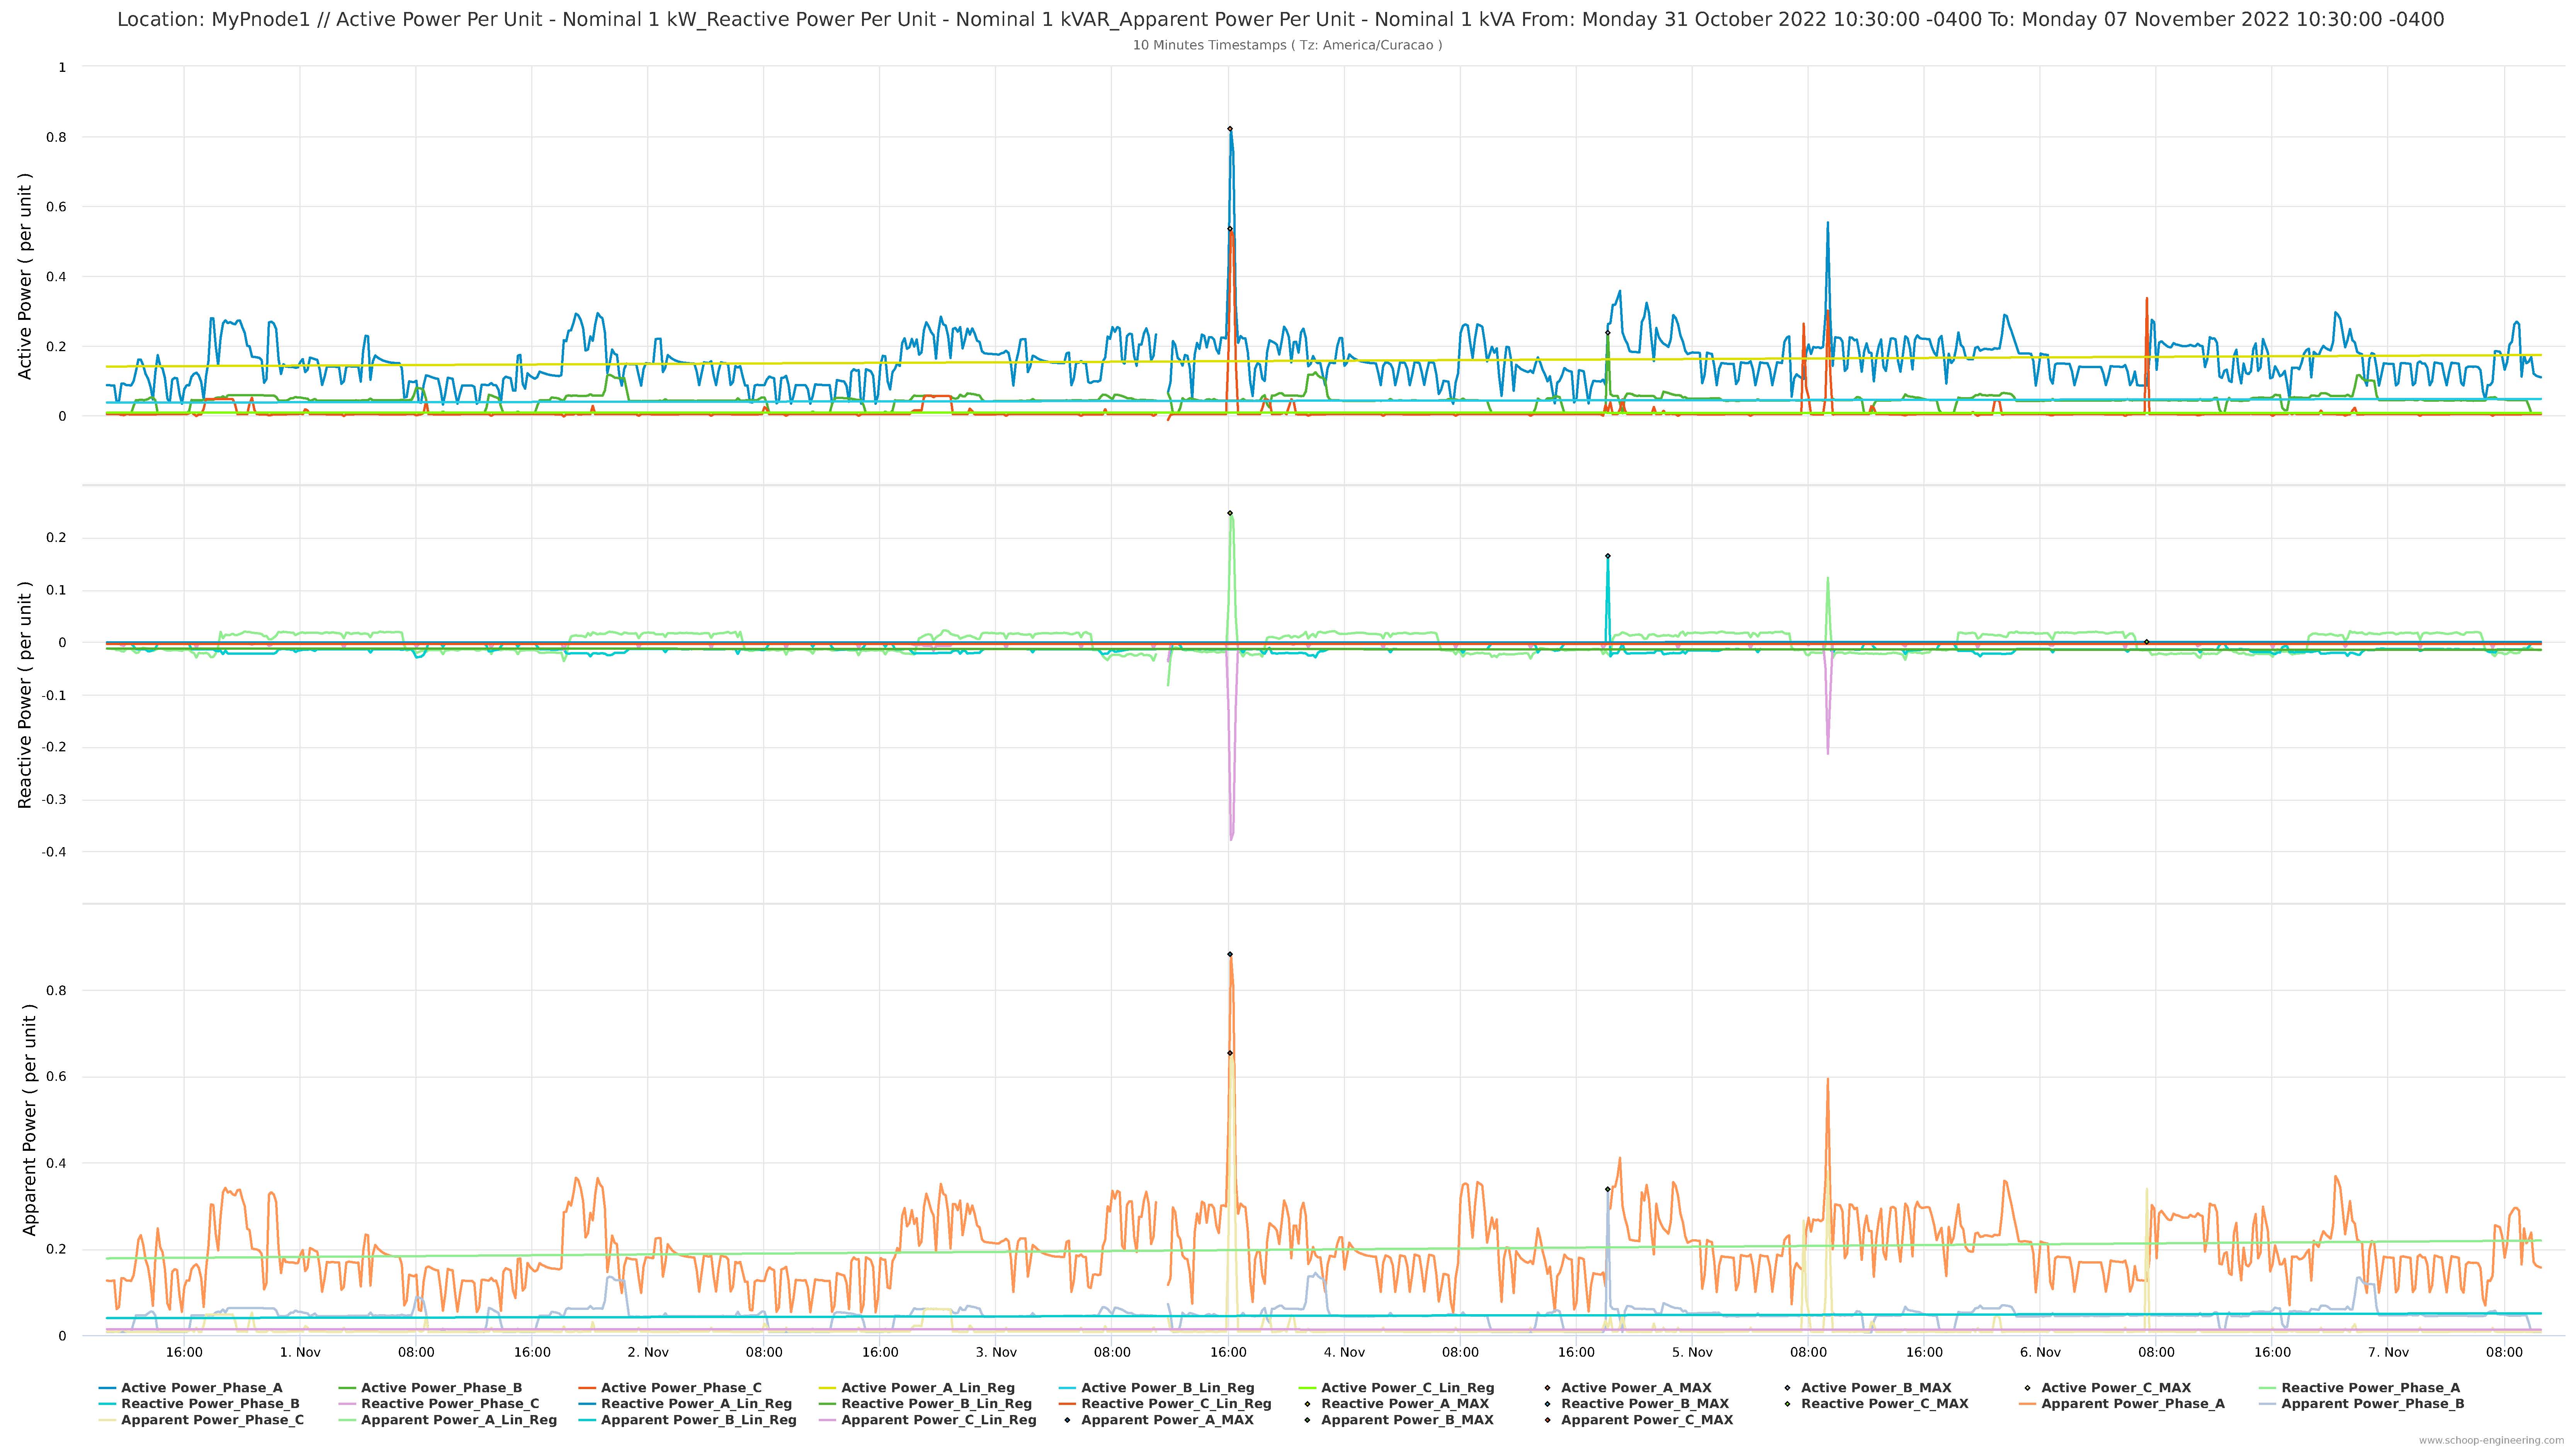
- do accurate real-time remote monitoring of electrical parameters
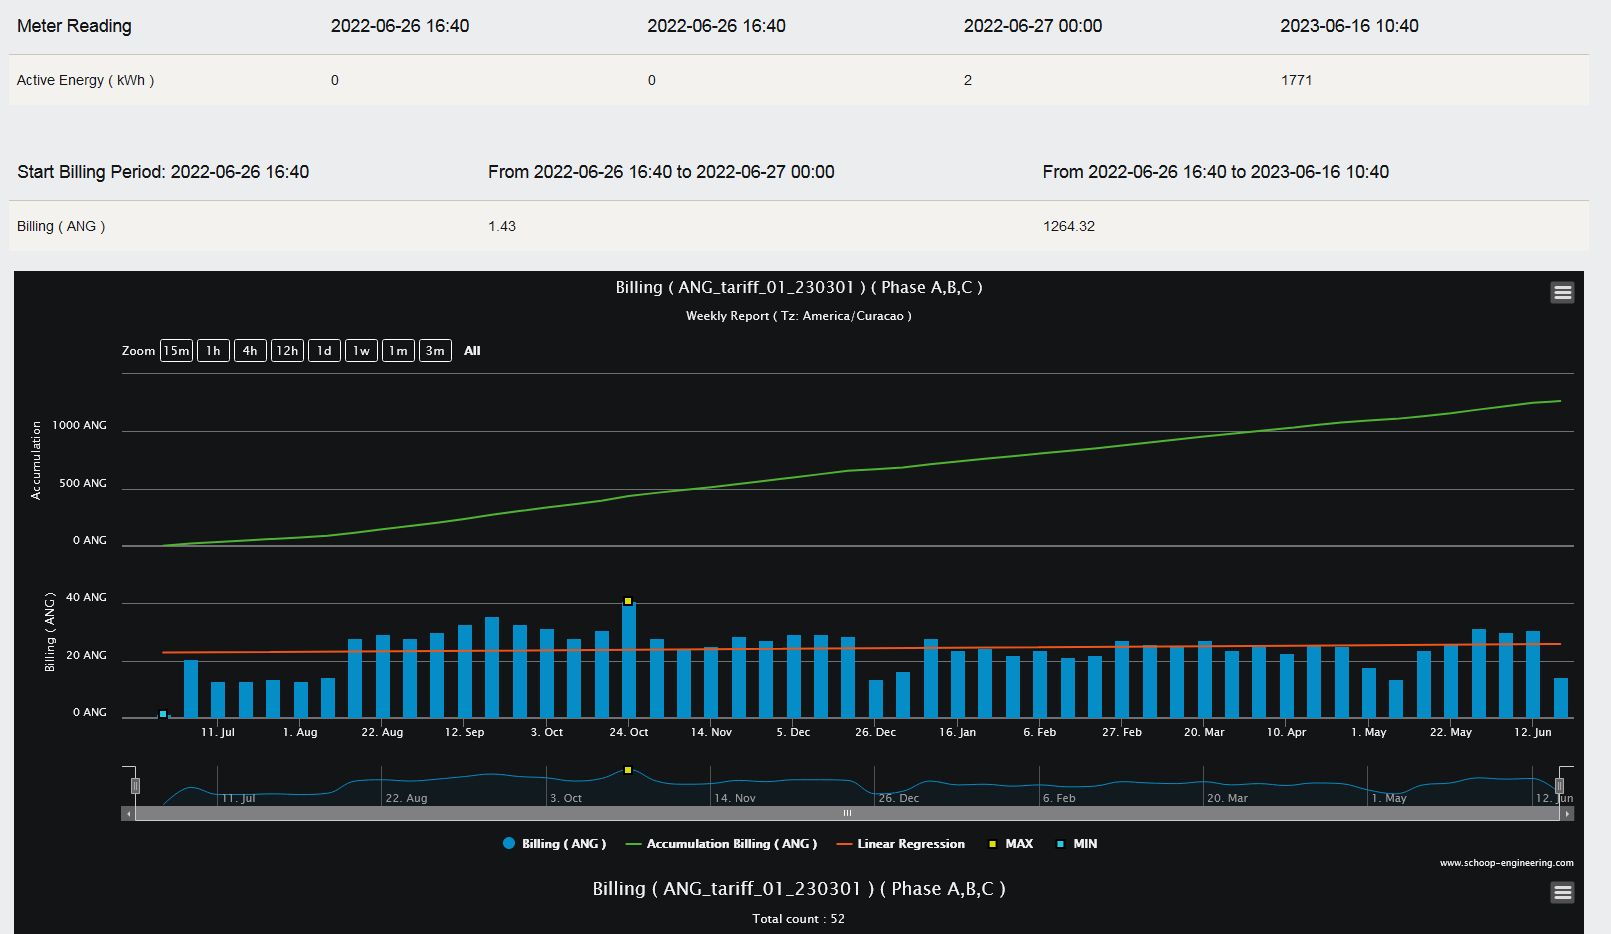
- do detailed cost analysis with actual billing tariffs
- do KPI analysis on your electrical installation
- act proactively and anticipate problems and issues in your installation before they even occur
- perform load studies to identify overloaded and unbalanced circuits
- keep track of imported and exported energy in solar panel installations
- quantify energy consumption before and after improvements
- collect data for analytics, historic trend analysis, pattern recognitions and forecasting
Live Demonstrations
For a live demonstration, please follow this link.
The username is demo and the password is demo.
For an automated reporting demonstration, please follow this link.
Submit your email address and within 3 minutes you will receive multiple up-to-date reports in your email inbox.
PNODE Power and Energy Monitoring - Data Logging and Recording
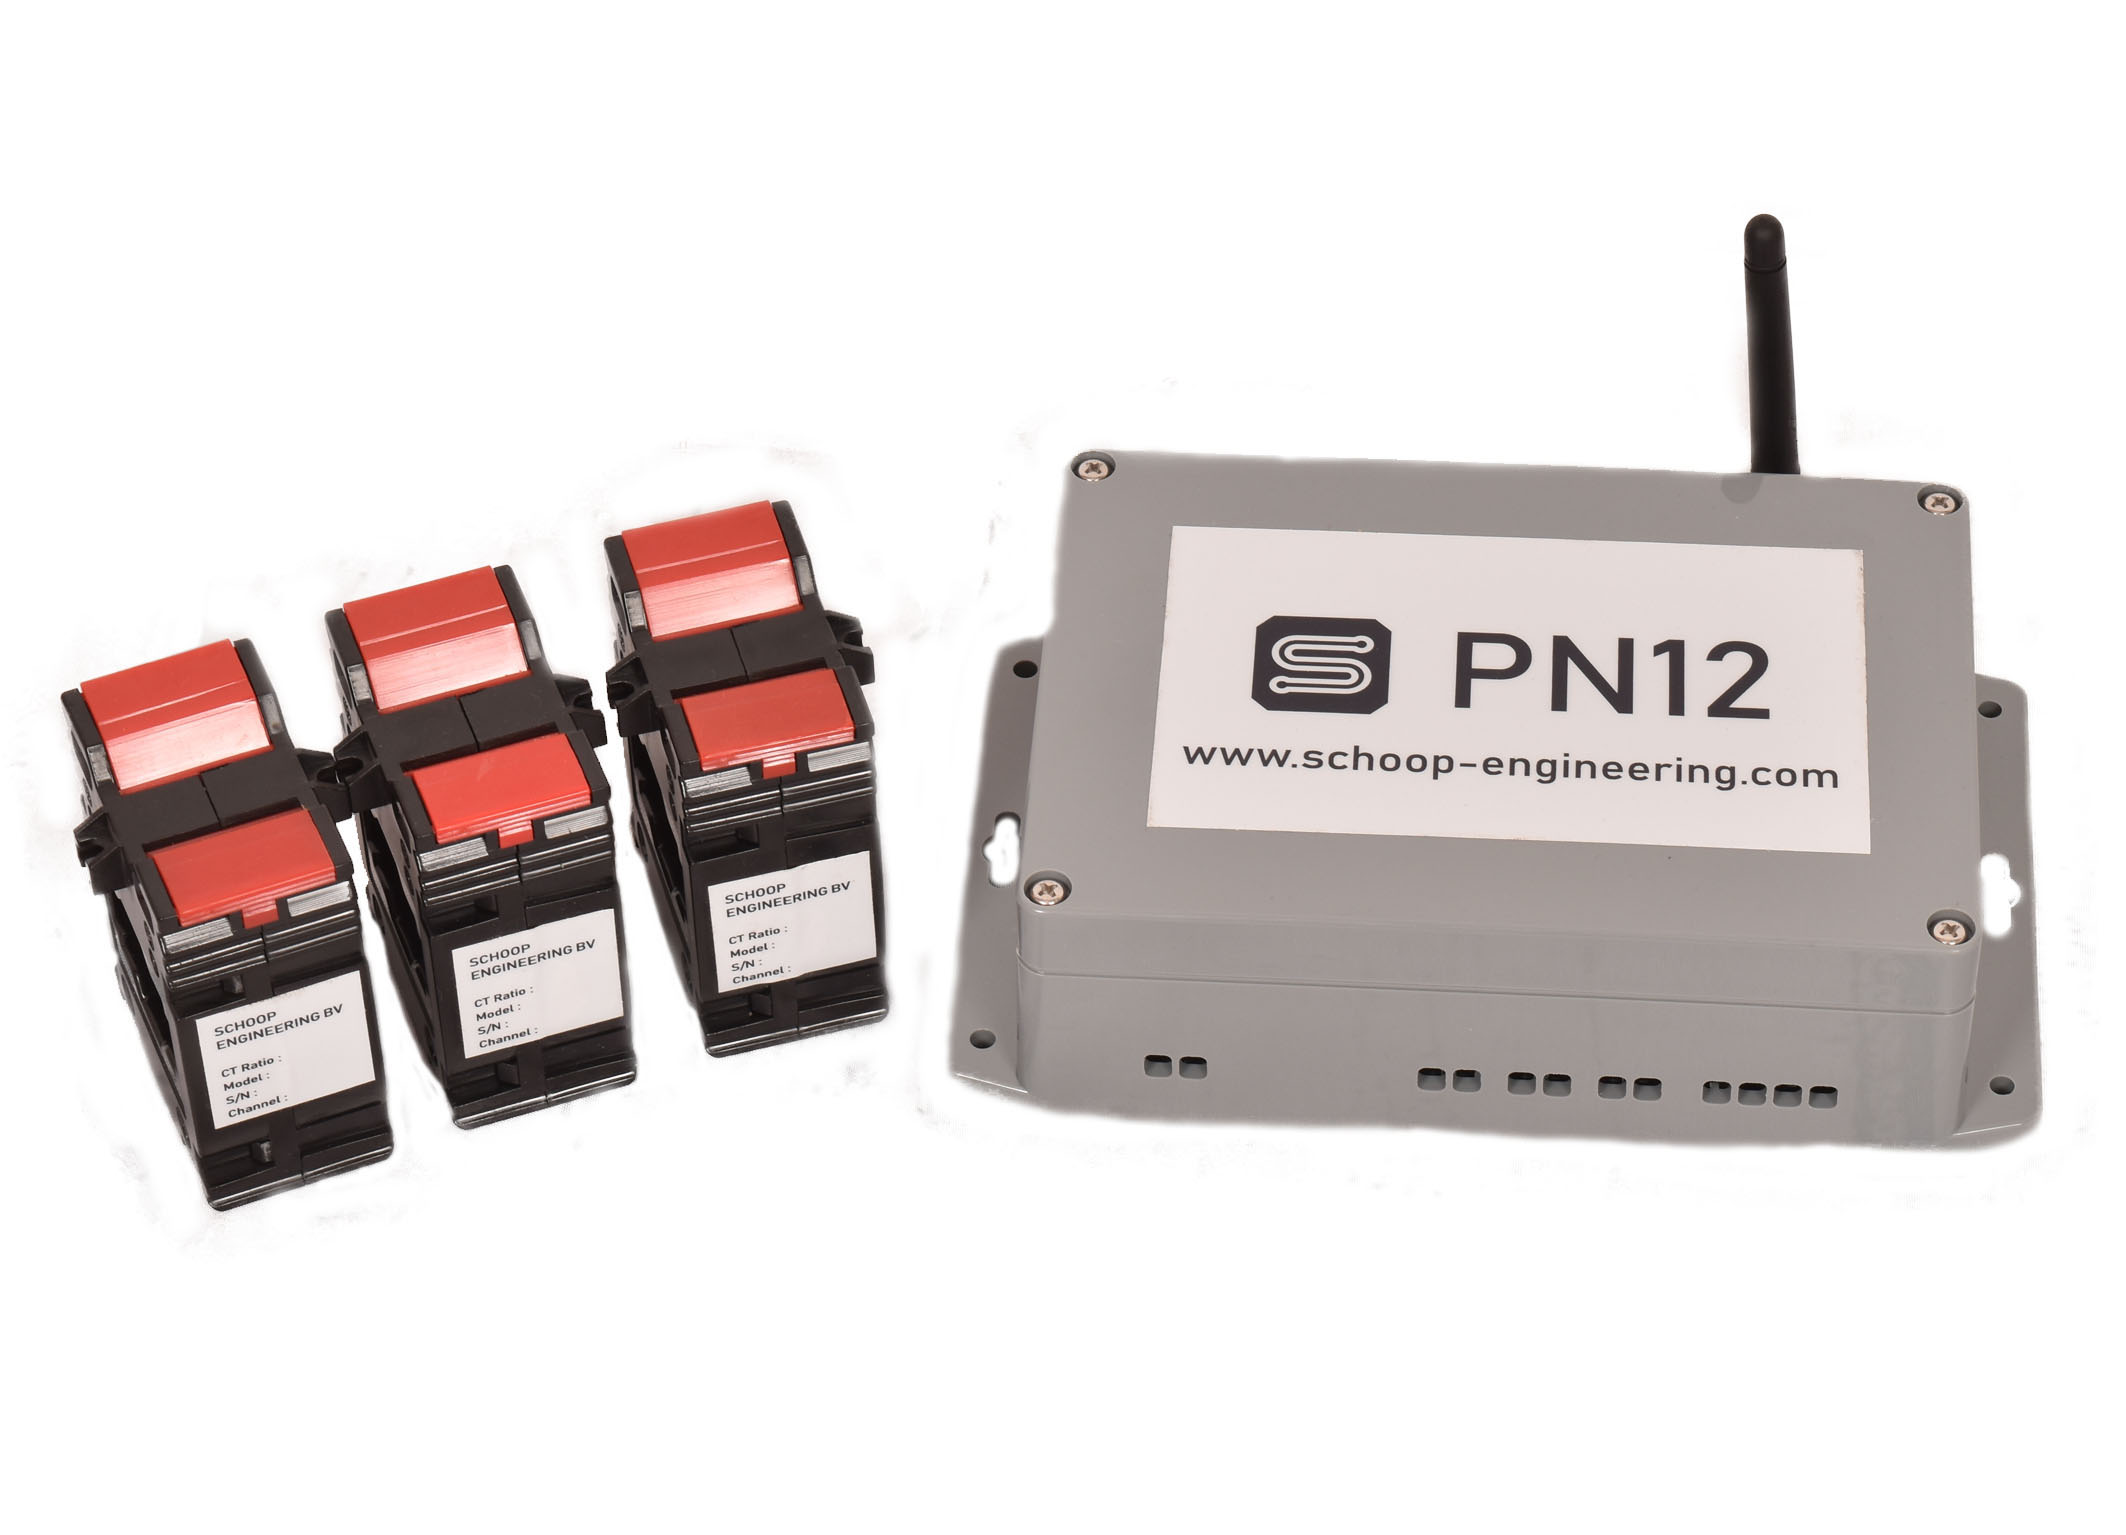
The PNODE makes the data logging and monitoring of electrical power and energy possible. PNODE stands for Power Node. The PNODE’s are deployed at critical nodes in electrical power distribution systems and power grids.
The PNODE sends data directly to our cloud network using a Wifi or a GPRS connection.
This enables simple smartification of any electrical power distribution system or power grid. Once the PNODE has been installed and configured, you can then only focus on the analysis of the gathered data and therefor save your time.
The PNODE is rated at CAT IV 300V conforming to IEC EN 61010-1 and IEC EN 61010-2-30 safety standards.
The PNODE has successfully passed the required Safety and EMC compliance testing. The PNODE obtained the CE marking. The certifications can be seen in the user manual.
For the user manual and more detailed information about the PNODE, please follow the Read More link.
Read More
Big Data Analytics in the Cloud
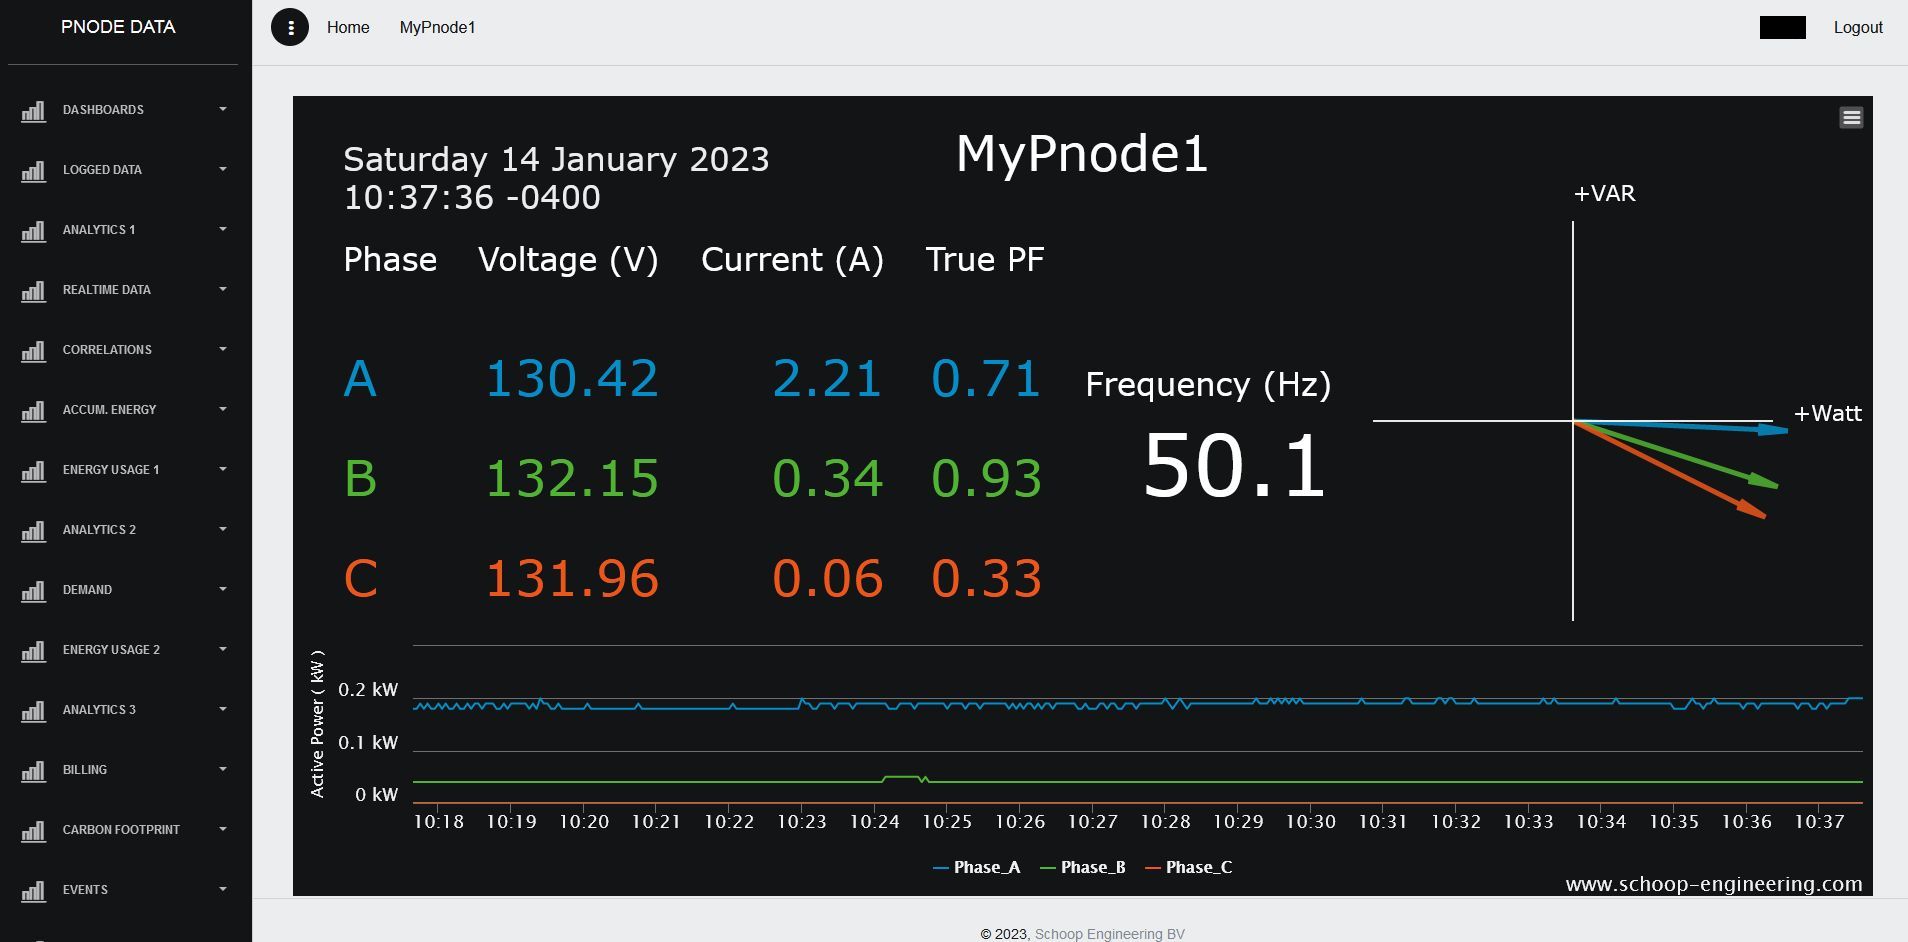
Once the PNODE has been installed and configured, you have access to online reports and start receiving automatic email reports. In a simple panel, an administrator can add and remove users from the system.
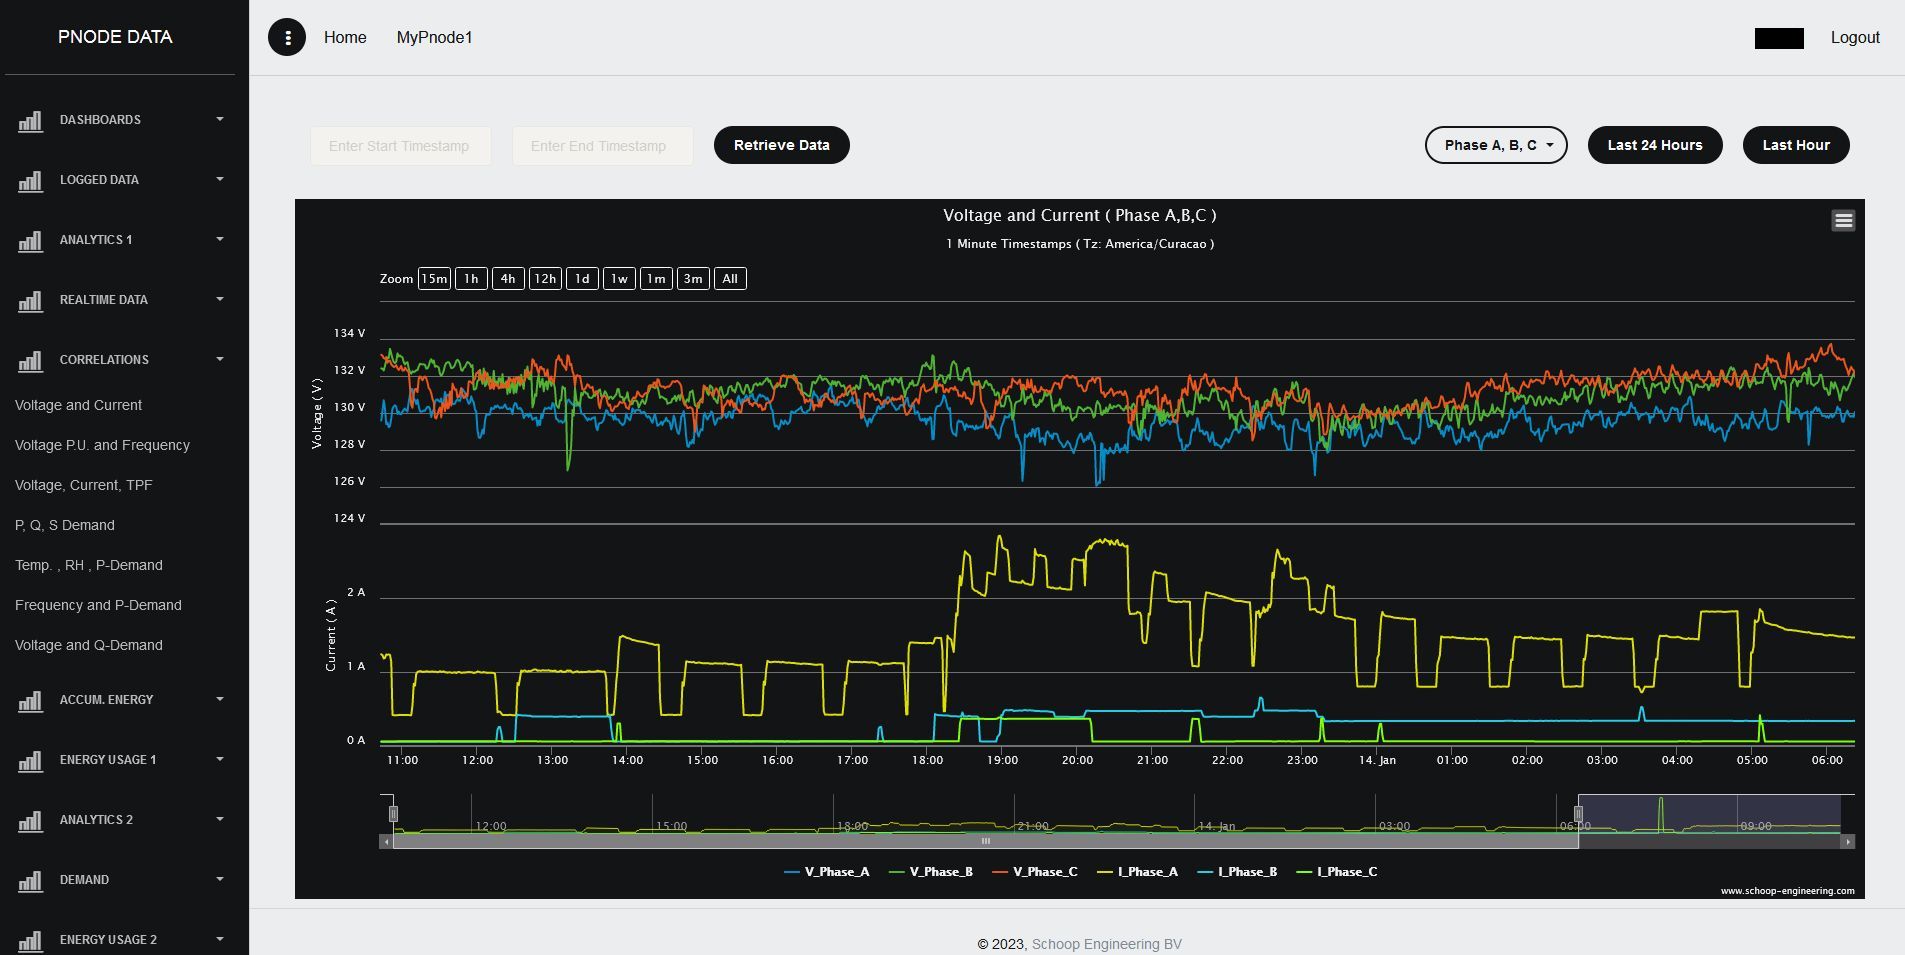
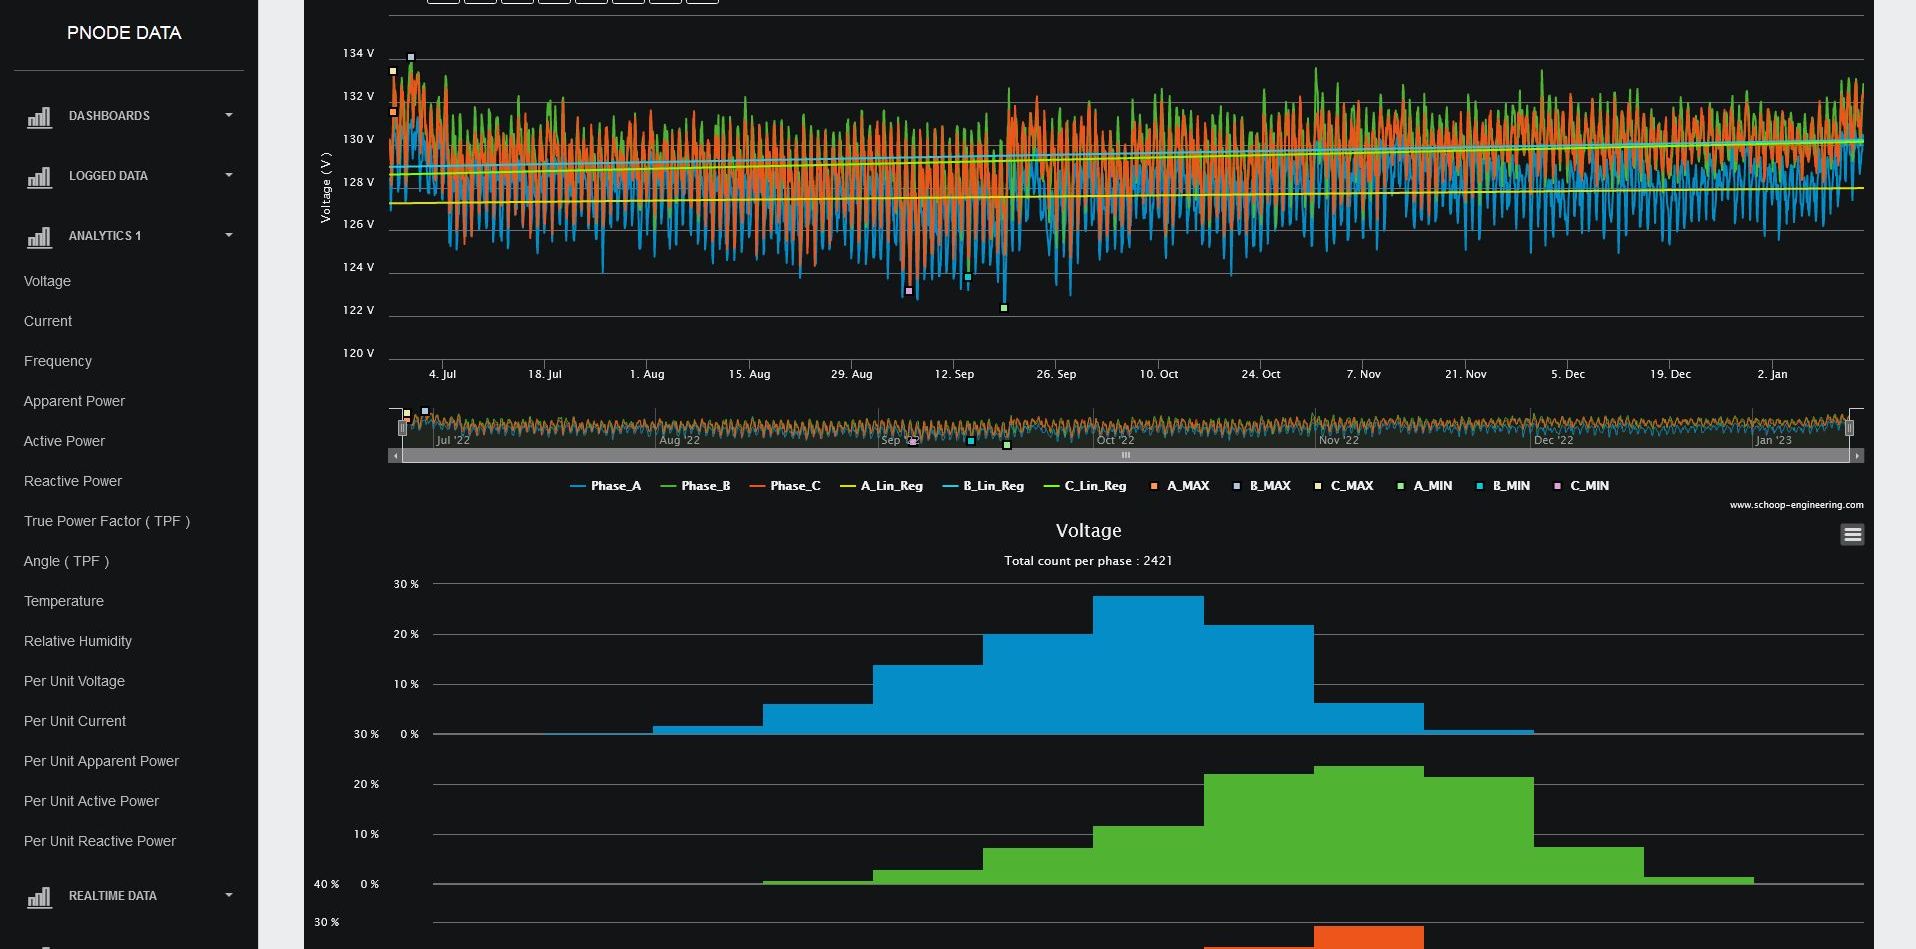
The cloud stores and manages 2 years of data for you. For example, it is possible to retrieve real-time 3-seconds data from 2 years ago on a specific day and during a specific time duration.
Analytics are executed, and visualizations are presented in diverse types of charts. It is also possible to request customized reports for each individual PNODE.
For real cases and more detailed information please follow the Read More link.
Read More
Contact Us
Please feel free to contact us for any questions, requests, or quotations at the email address below.