The PNODE devices send measurement data to our cloud network.
The data is analyzed and visualized on a simple way for all users.
Measurements, monitoring and data visualization are vital first steps towards optimization and improvement of electrical installations.
Cloud Big Data Analytics on Power and Energy Measurement Data
Our PNODE cloud network makes big data analytics on power and energy data easy for all type of users.
The PNODE's send data directly to our cloud network for storage and analysis.
The data is accessible online and periodic automatic reports are sent to email inboxes.
The online web application is responsive which means that the data is accessible on personal computers and on mobile phones.
Several types of data are visualized in a diverse set of charts:
- Dashboards with important electrical power parameters
- Logged data over a long period of time
- Real time data
- Power demand data
- Total Energy data
- Energy data: monthly, weekly, daily and hourly
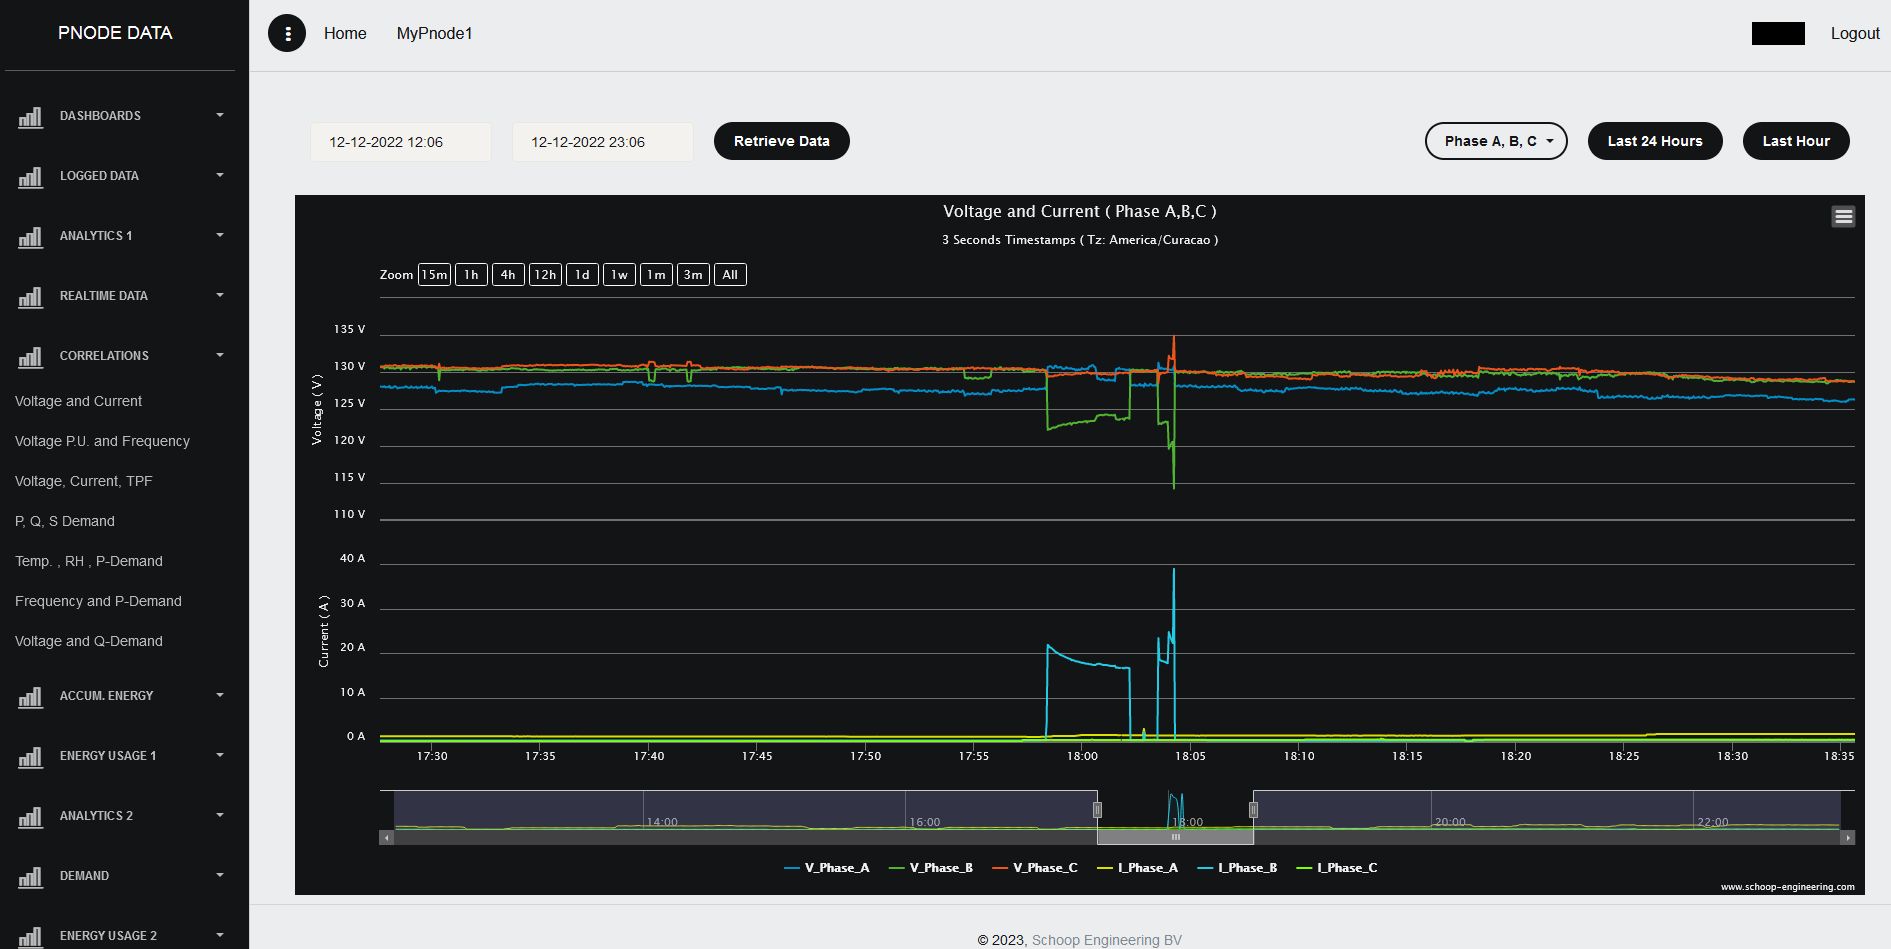
- Correlated parameters on the same chart
- Billing data (monthly, weekly, daily and hourly)
- Carbon Footprint (monthly, weekly, daily and hourly)
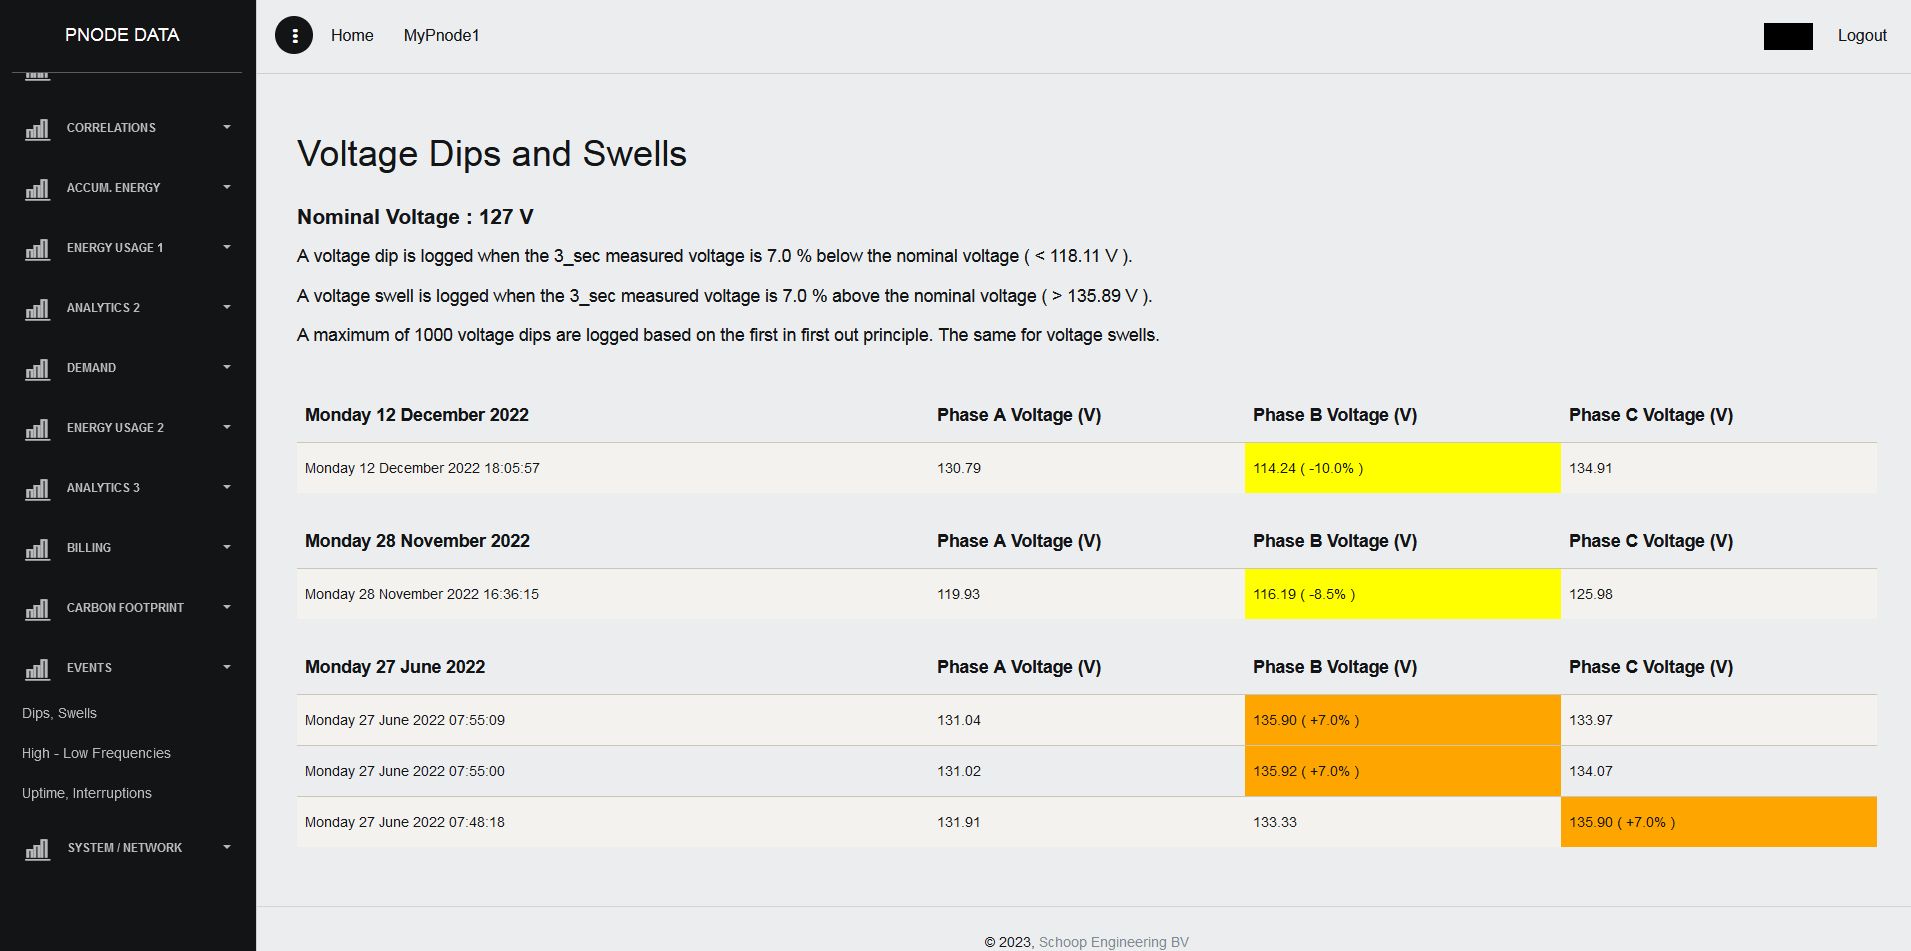
- Events: Dips, Swells, Frequency deviations and Interruptions
- System and network performance data
Four types of data are stored in the databases. These are the 3-seconds, 1-minute, demand and 2-hours interval data. It is possible to zoom in and out between these different types of timestamps in the online charts. It is also possible to zoom in and out between the monthly, weekly, daily and hourly data.
CSV files are generated for the automatic email reports so data analysts can use these files for analytics, historic trend analysis, pattern recognitions and forecasting. CSV files can also be downloaded easily from the online charts for specific dates and specific time durations.
Data can be visualized with or without analytics. When data with analytics is selected, several analytic metrics are calculated and presented. Below an overview of the analytic metrics:
- Linear Regression
- Maximum
- Minimum
- Mean
- Median
- Standard Deviation
- Histograms
The best way to evaluate the PNODE cloud is to study all the benefits as shown in the live demonstrations. What you see in these demonstrations is what you get for your own situation.
For online access please follow this link.
The username is demo and the password is demo.
For automated reporting please follow this link.
Submit your email address and within 3 minutes you will receive multiple up-to-date reports in your email inbox.
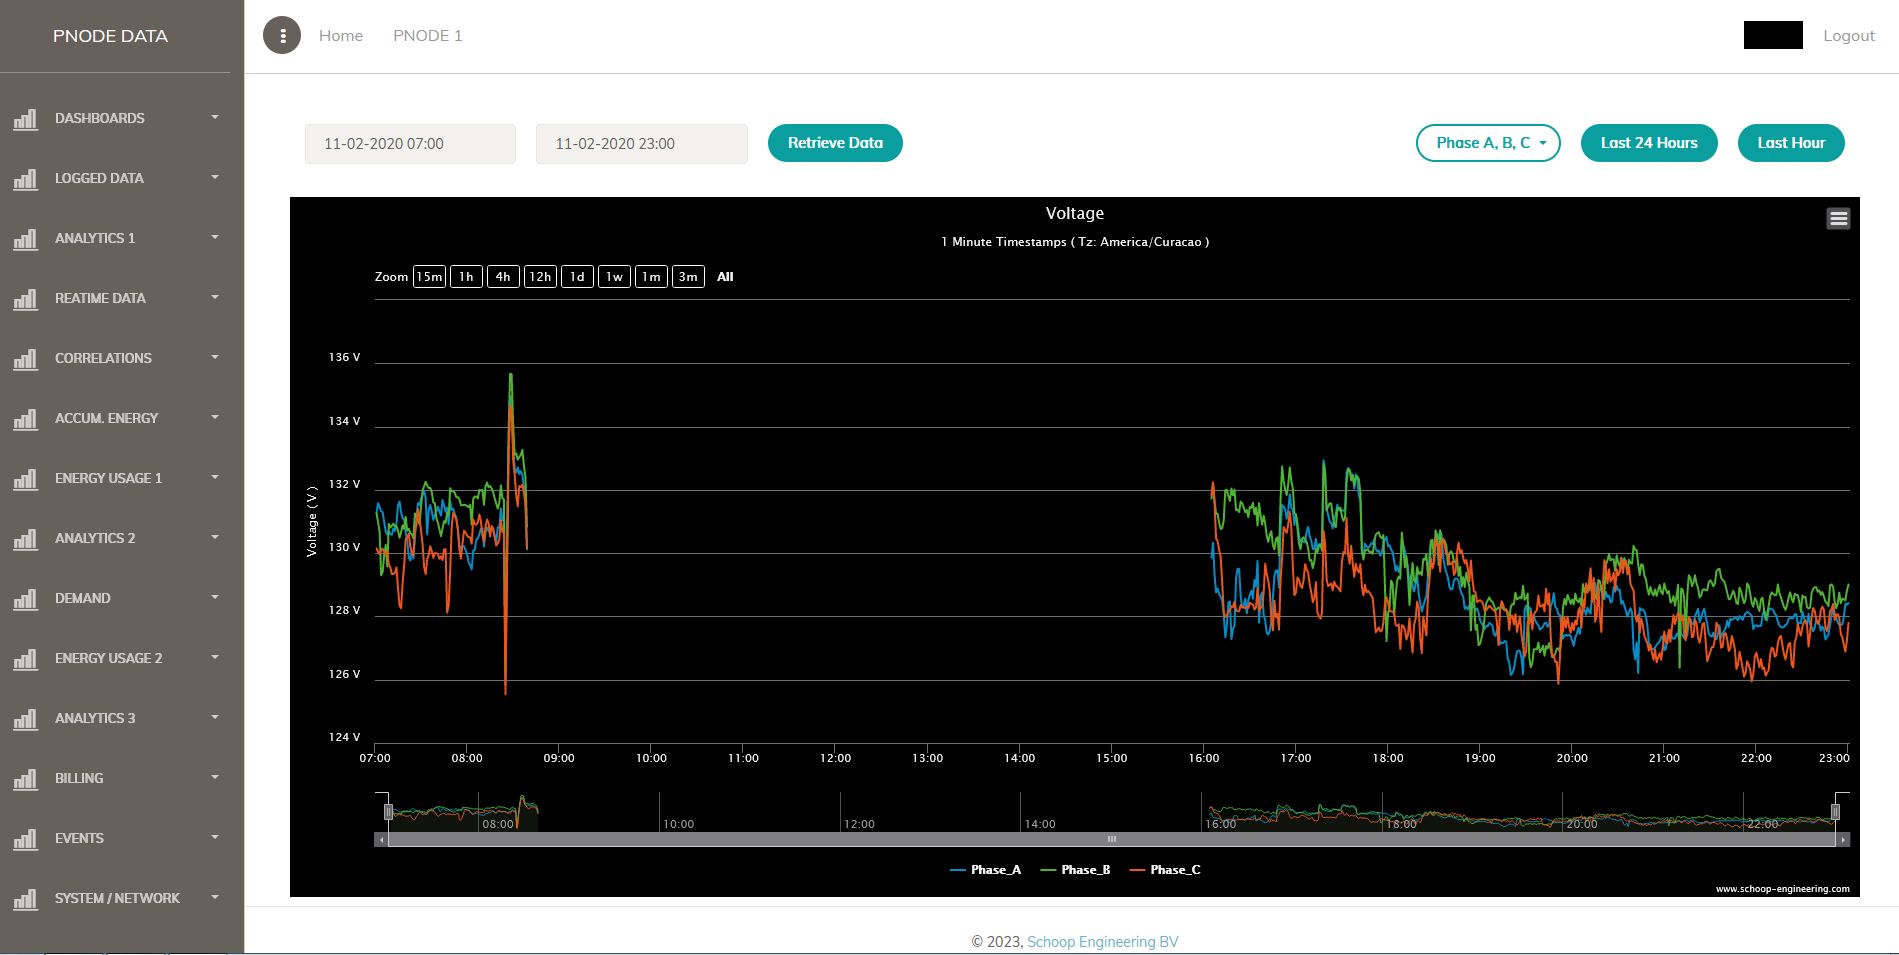
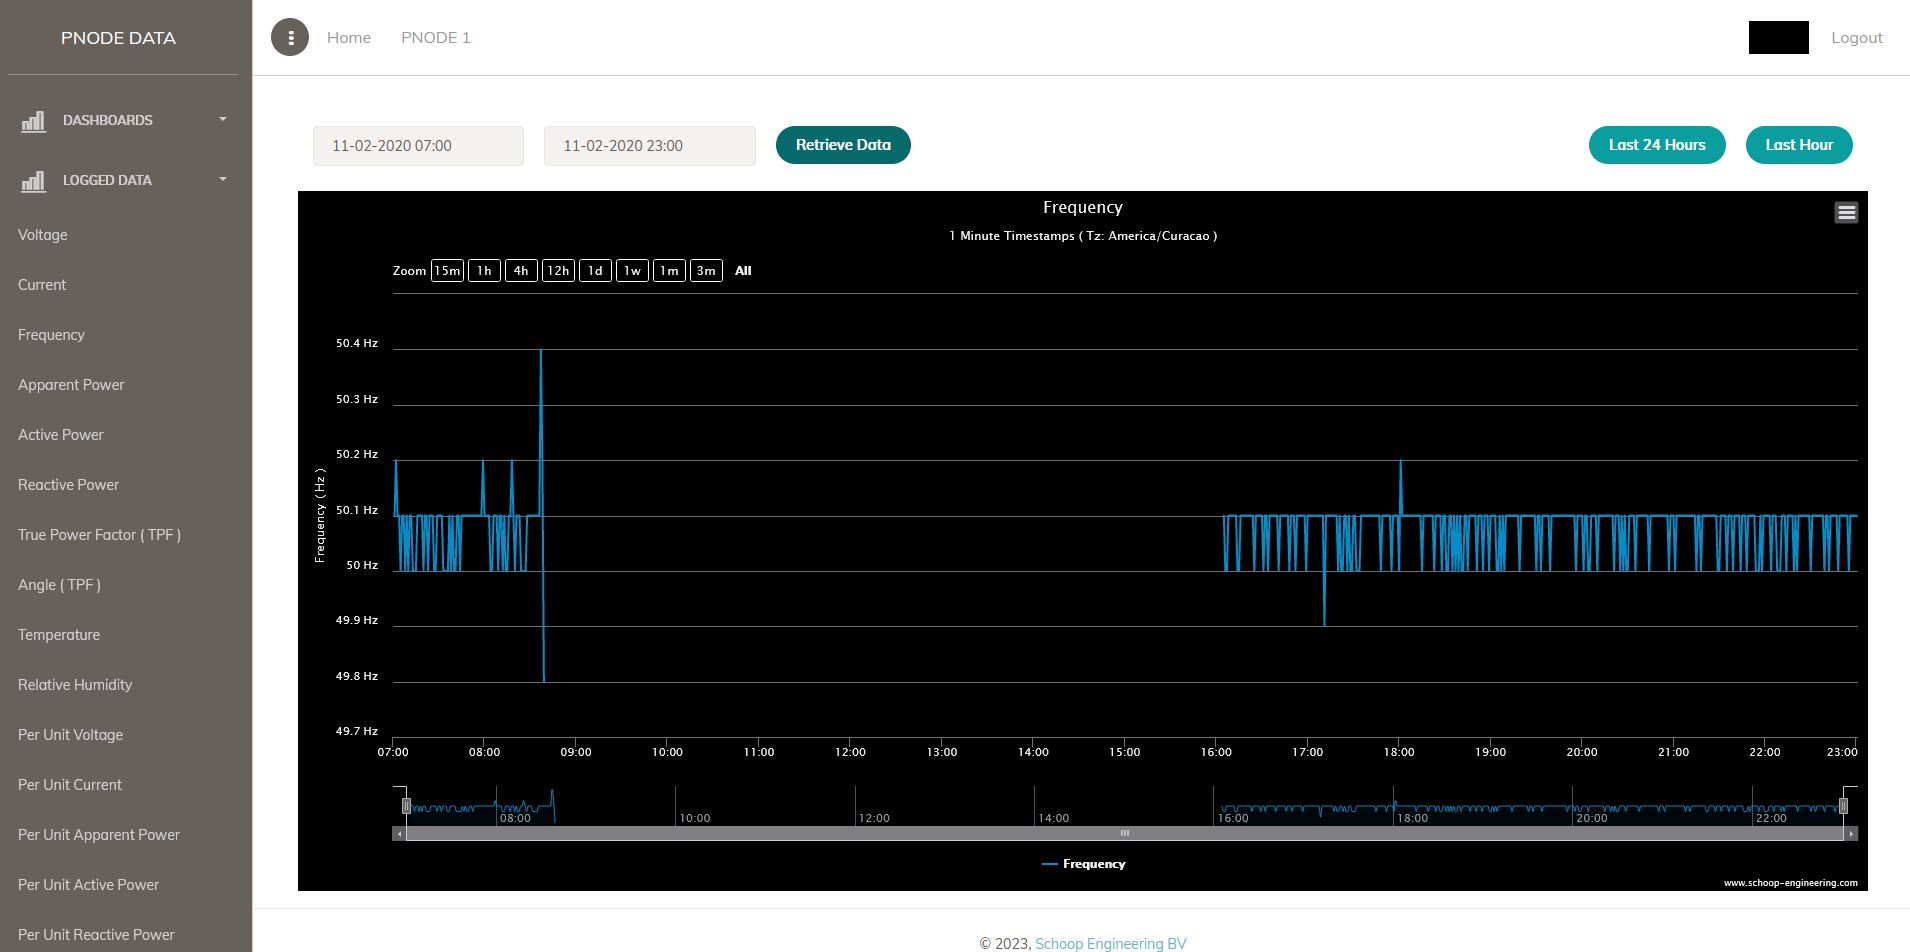
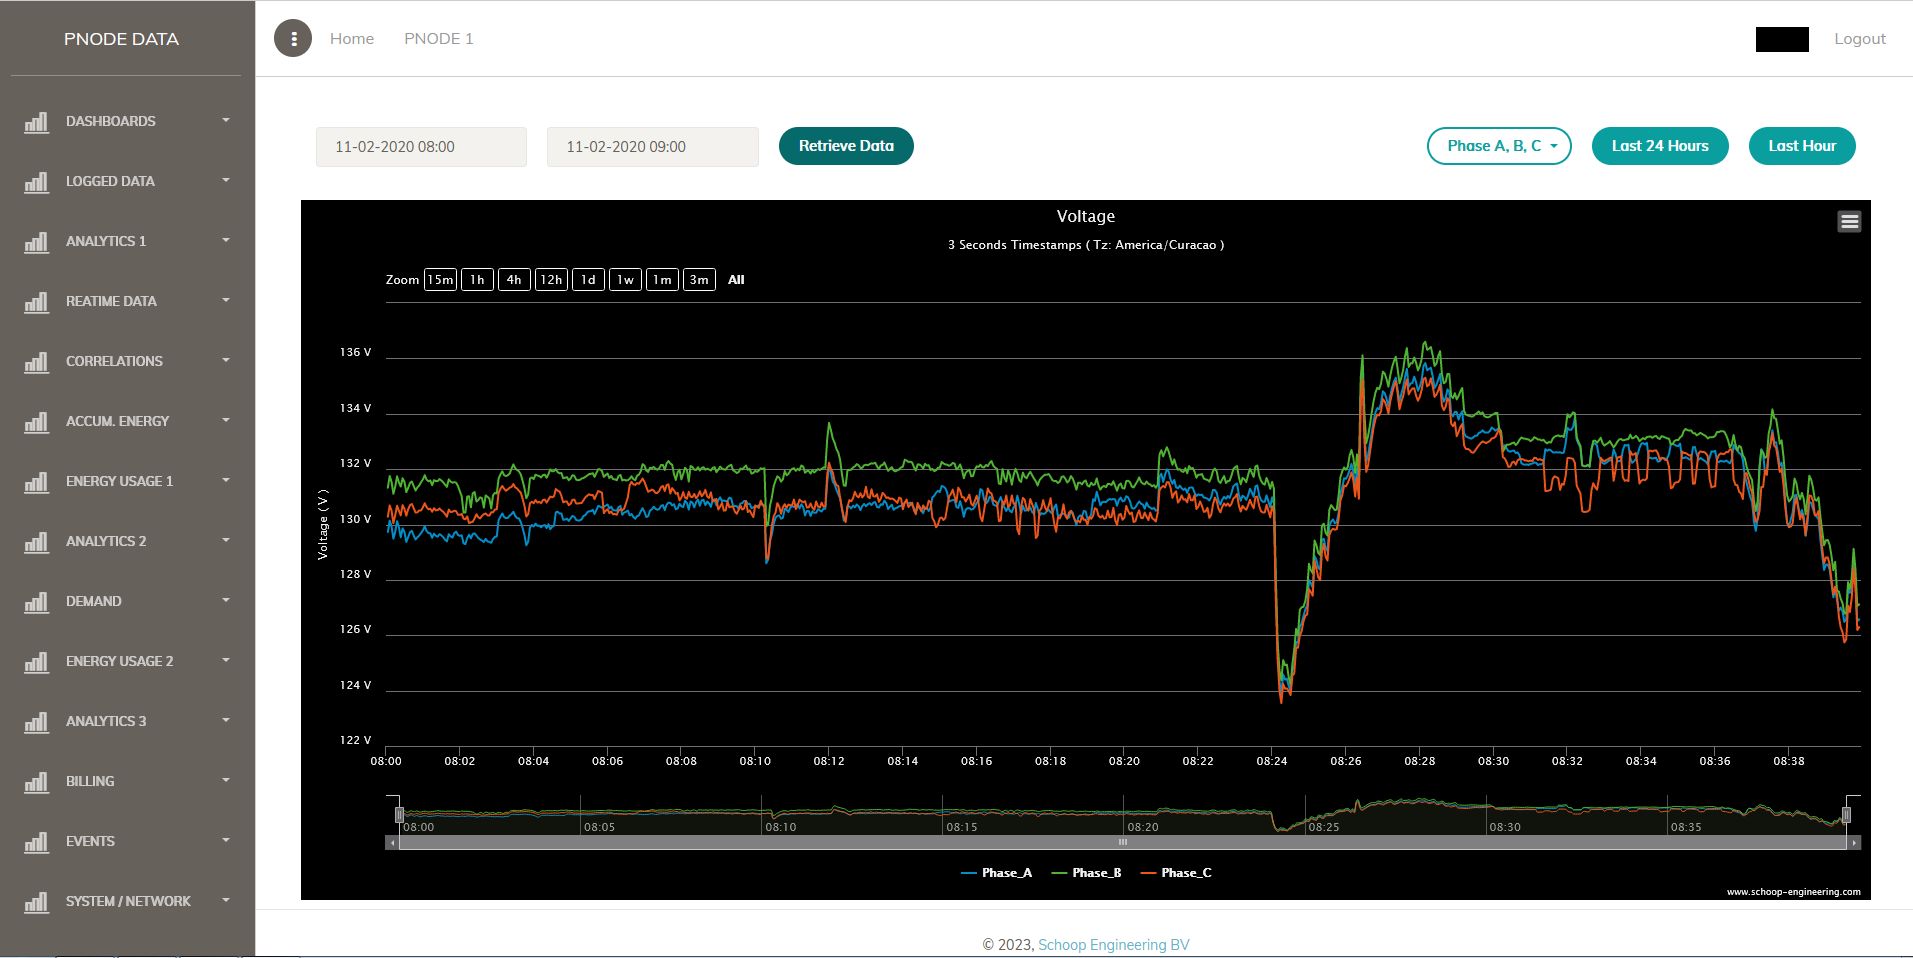
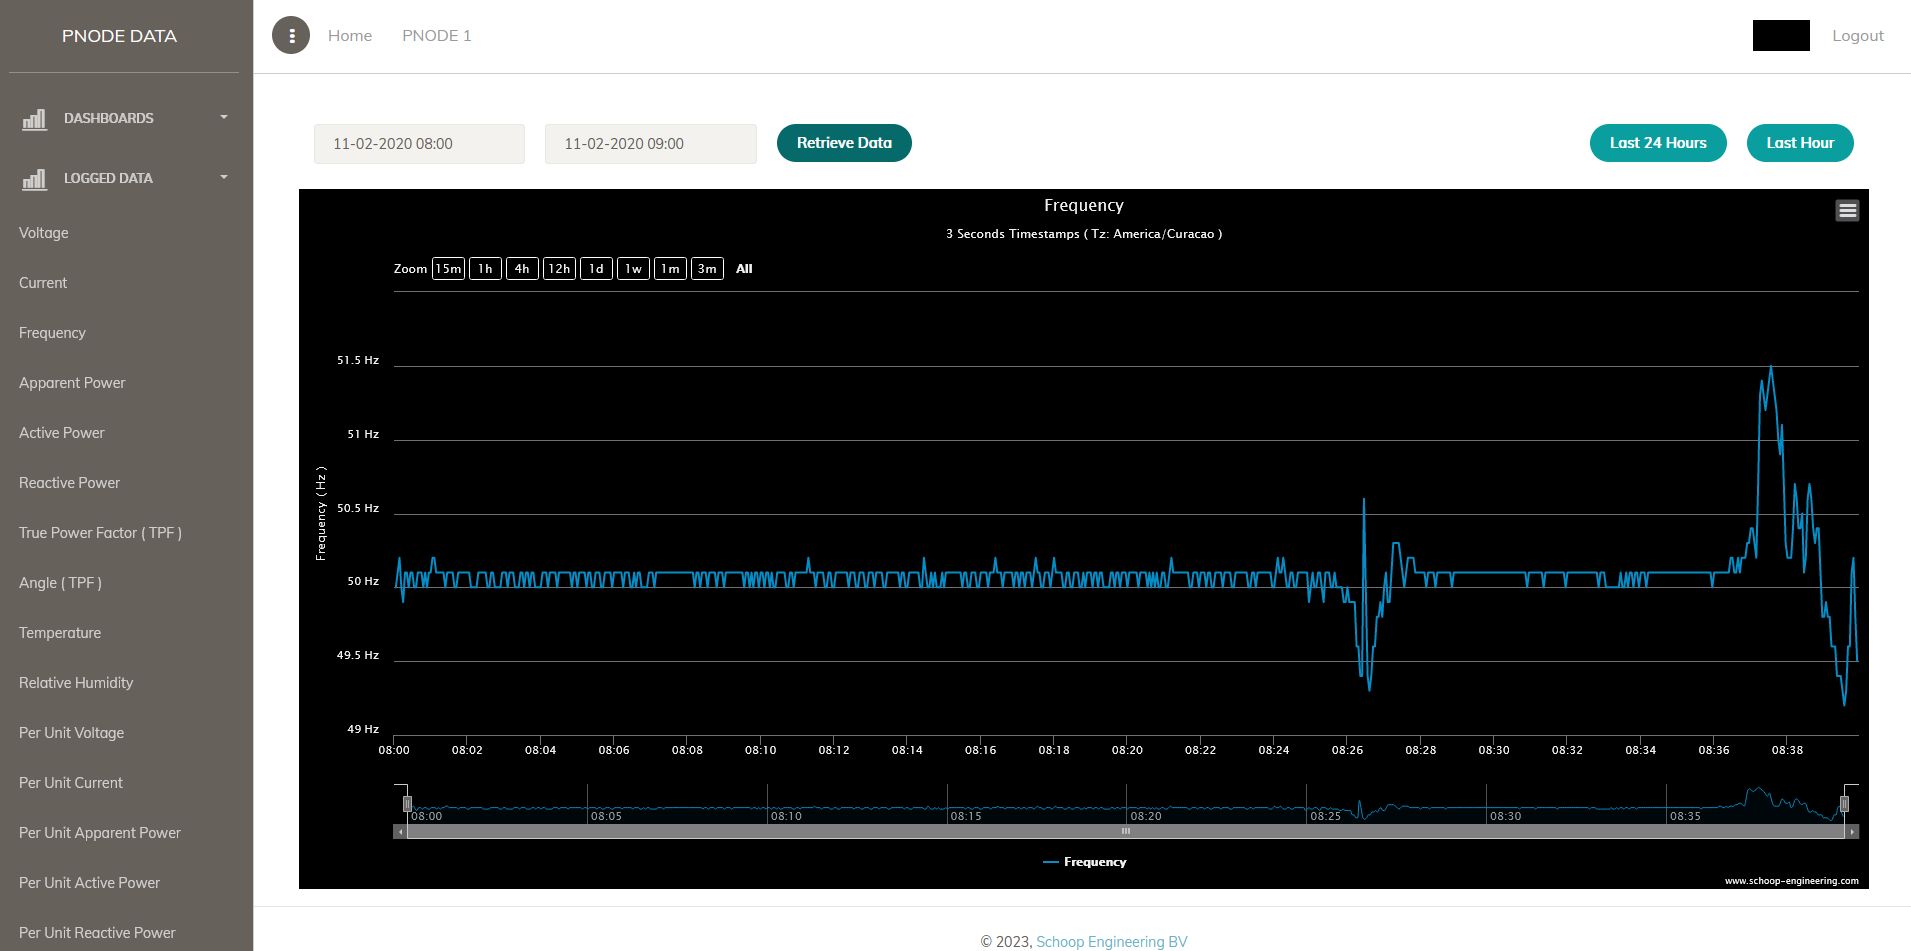
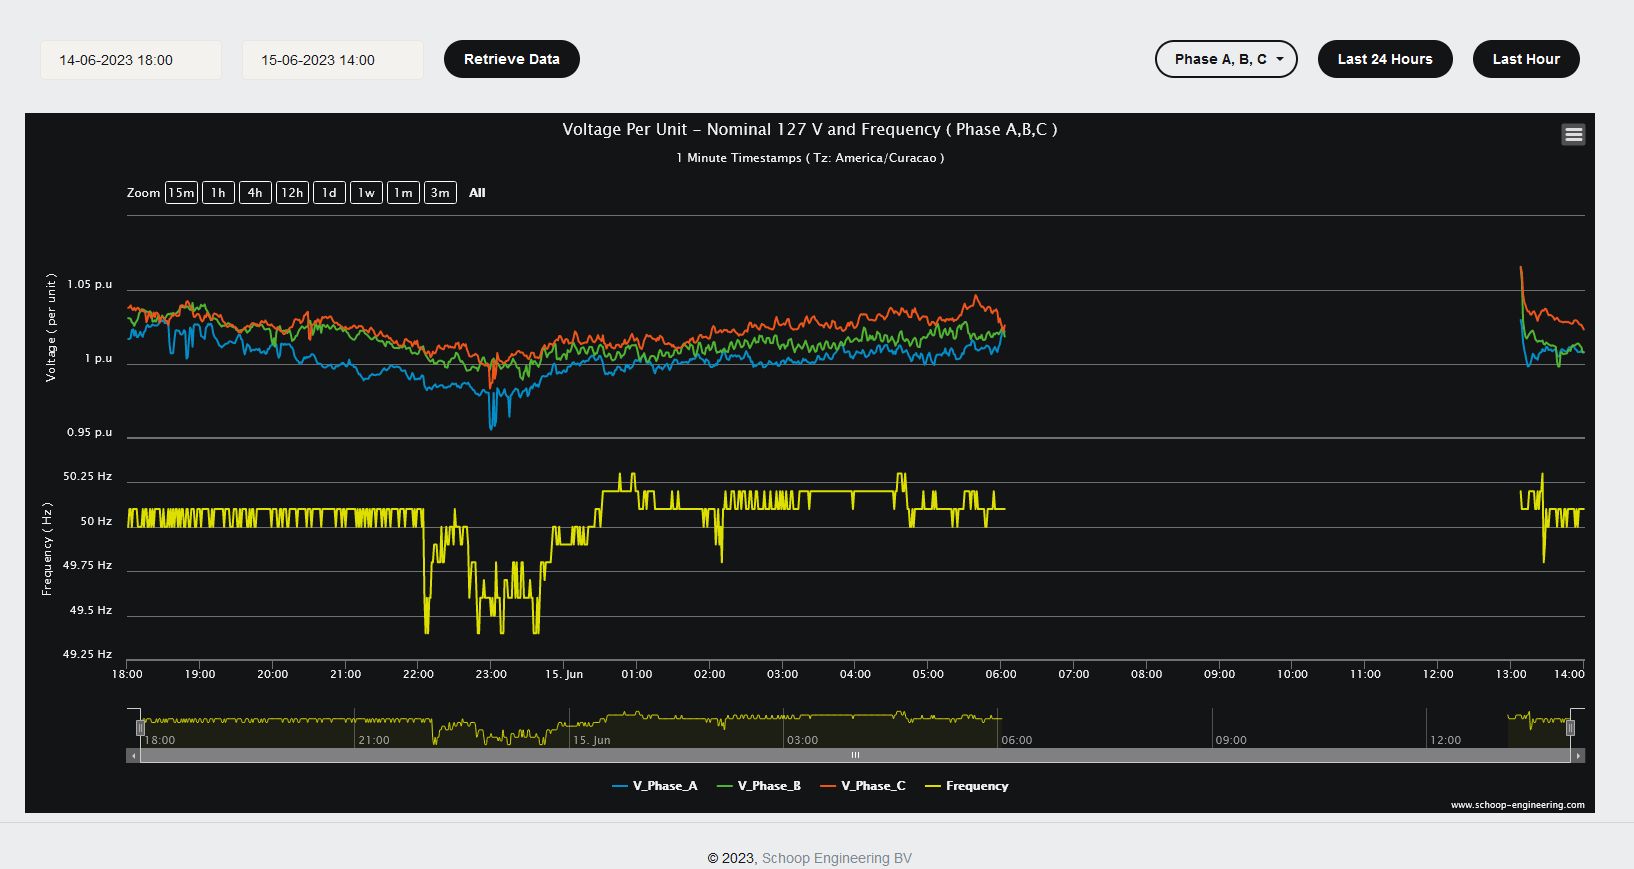
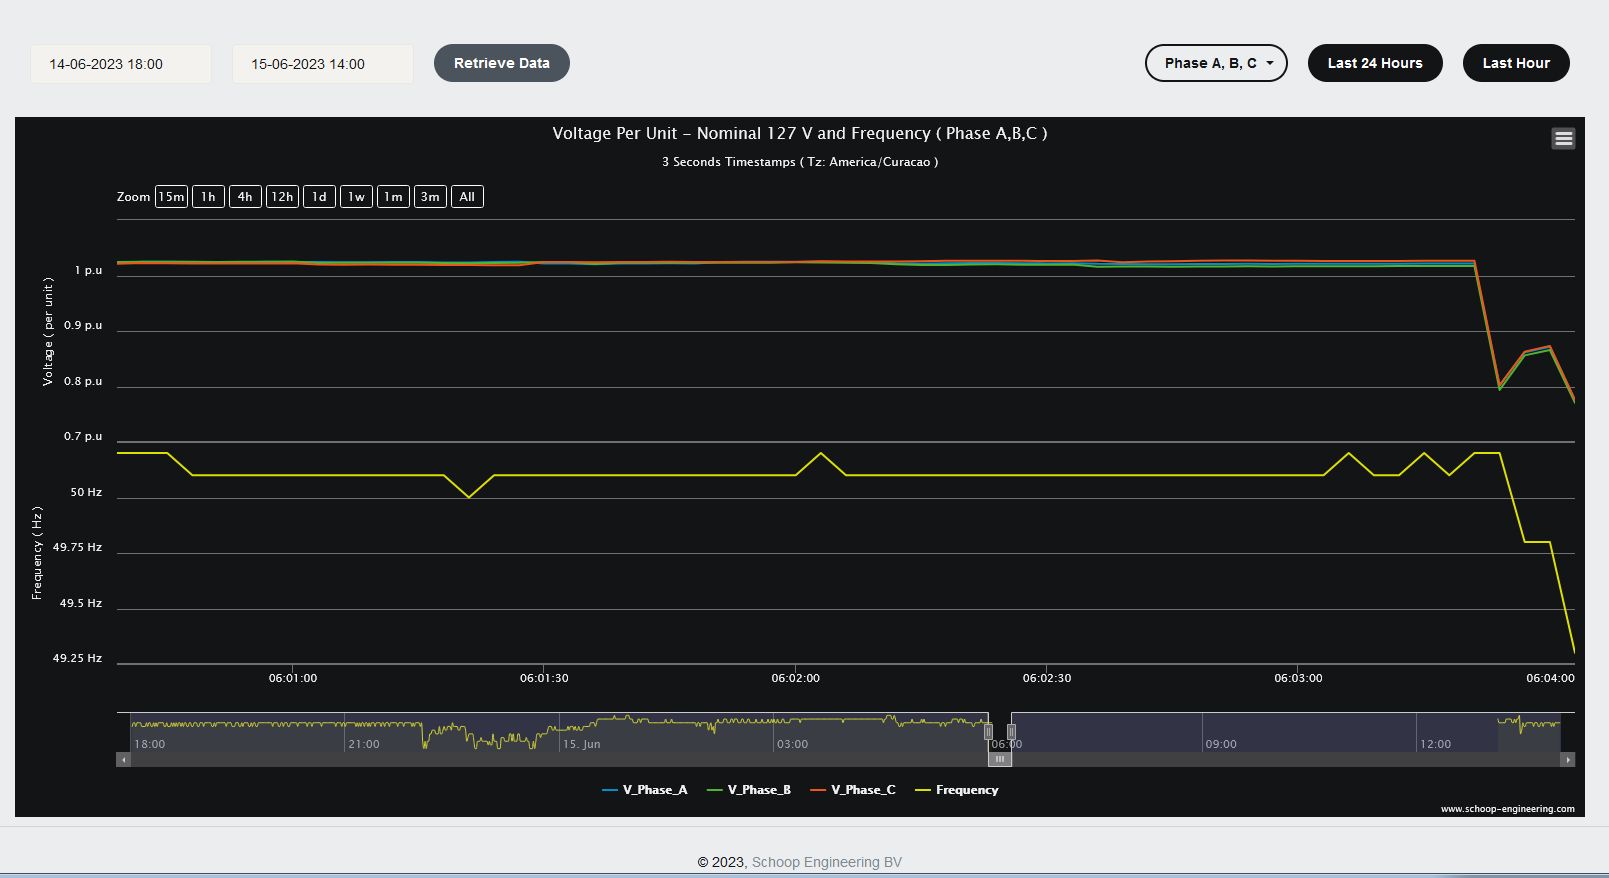
Real Case 1
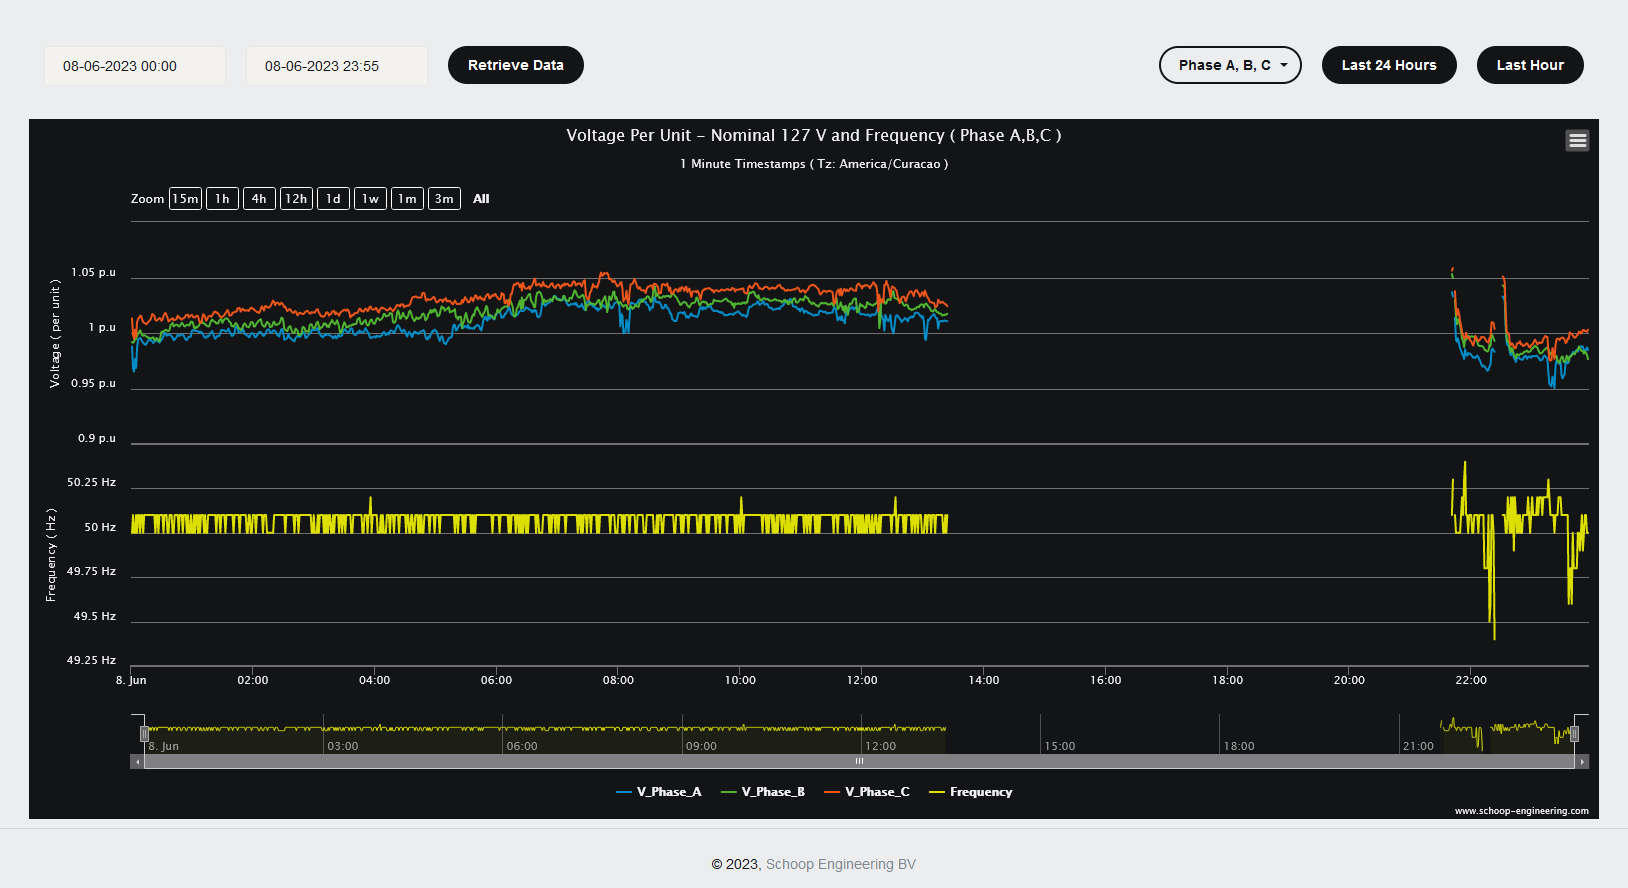
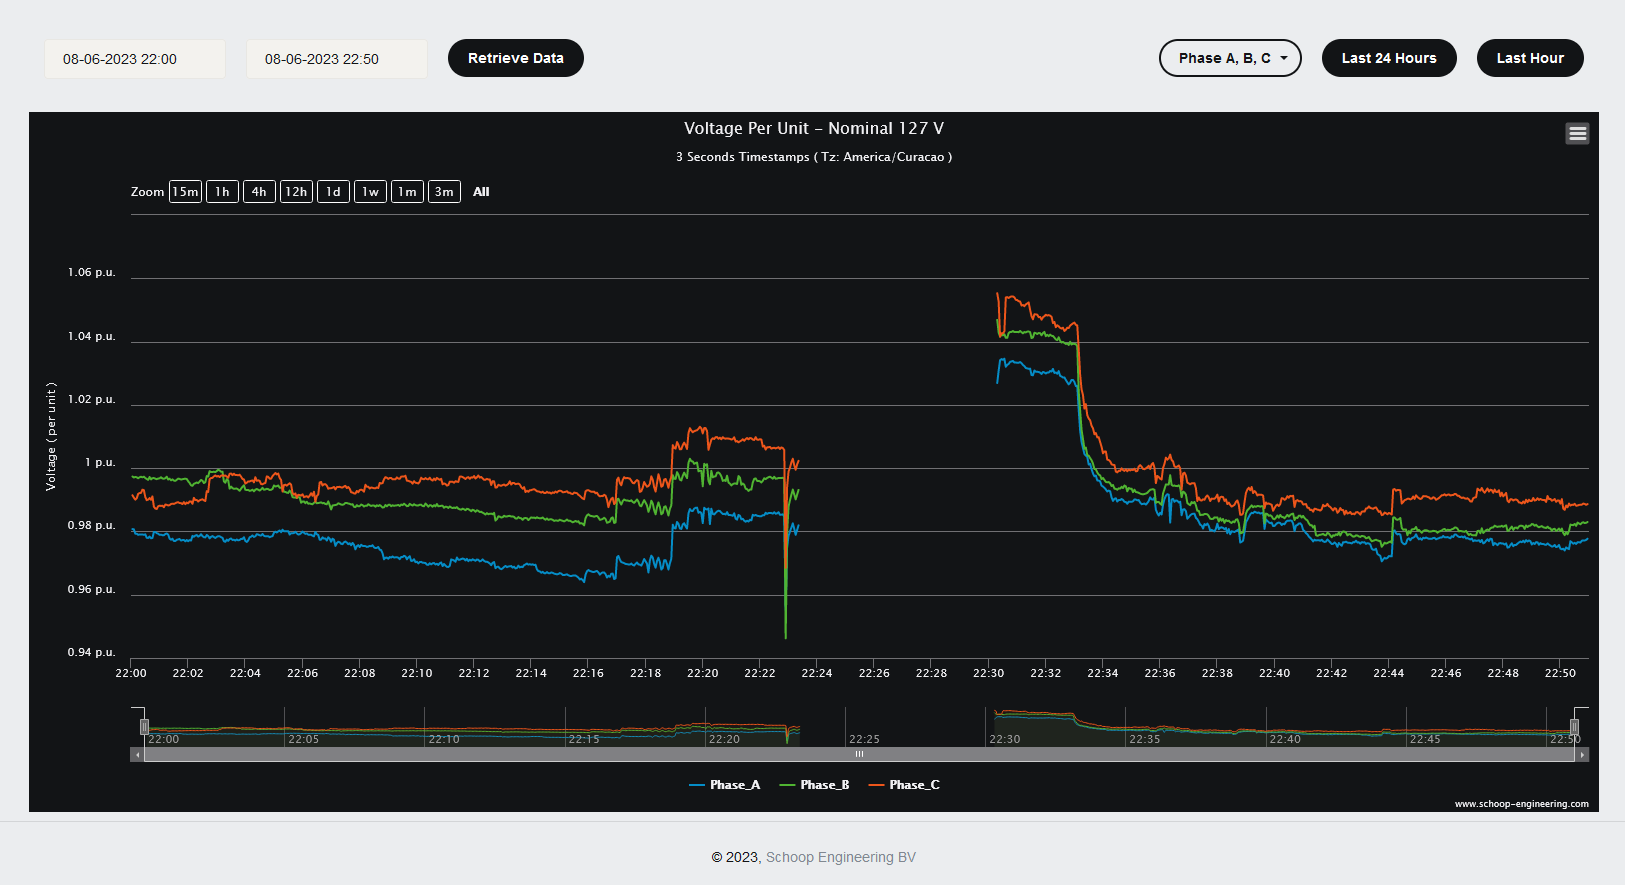
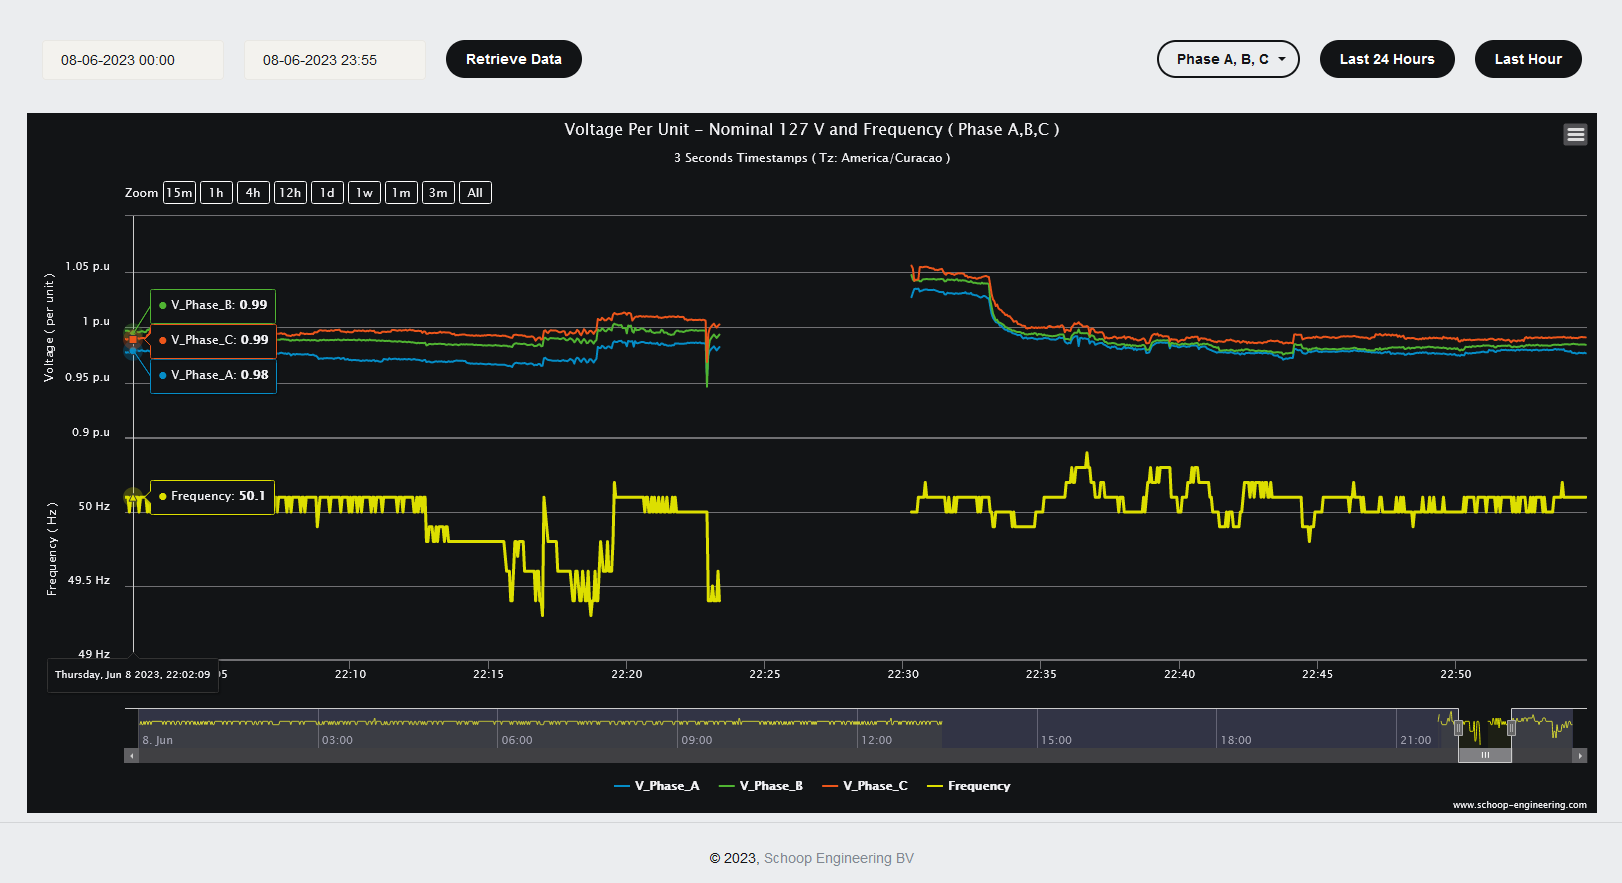
On the following images you can see voltage and frequency behavior during a day with a power outage. You are also able to see the voltage and frequency behavior just seconds before the power outage.
Real Case 2
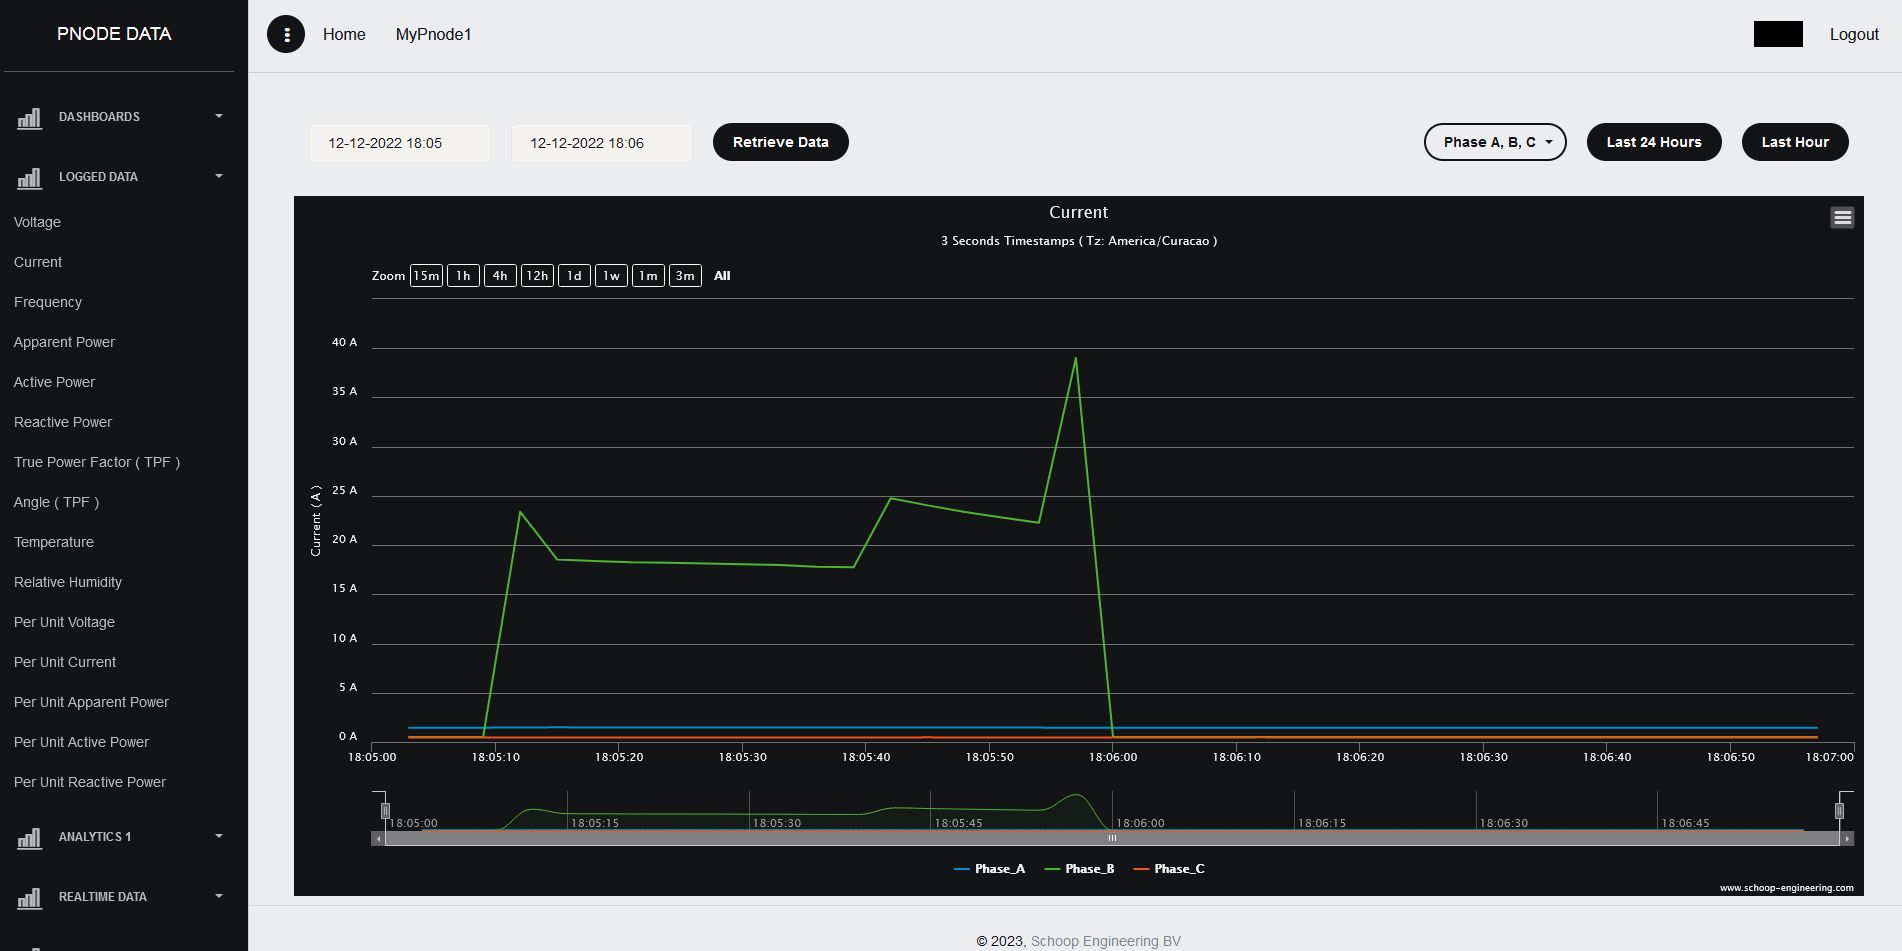
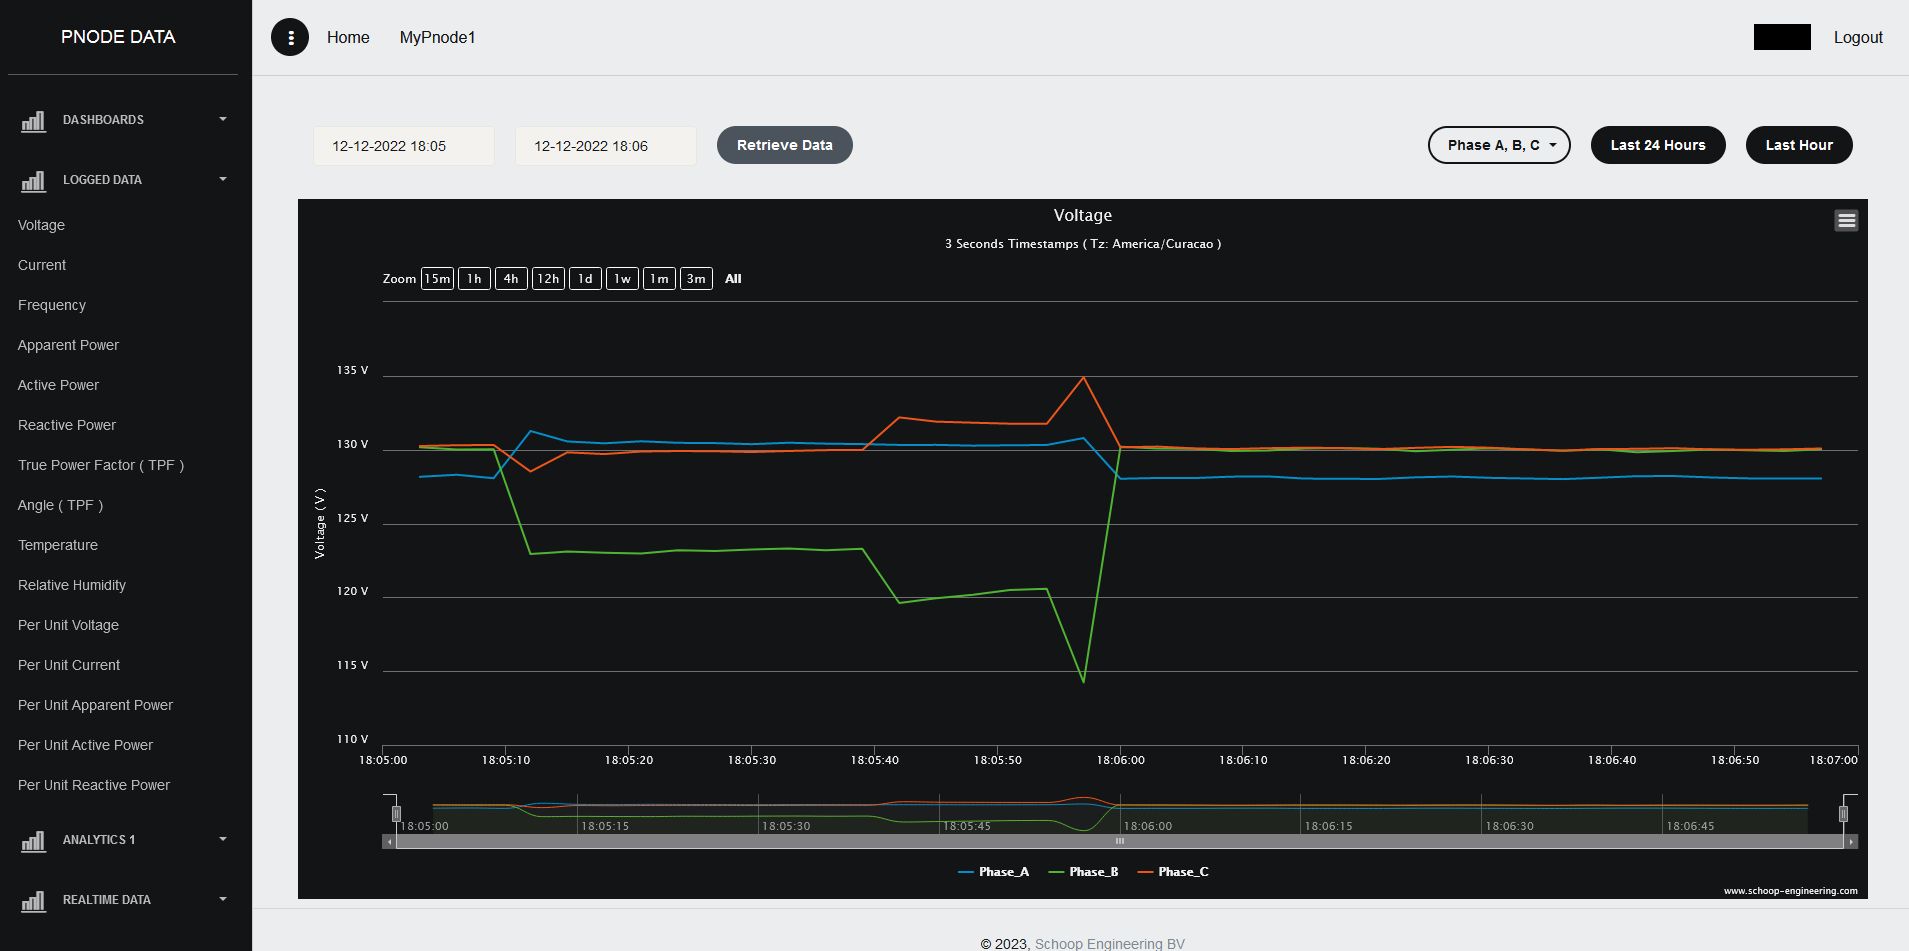
This case illustrates a meltdown of an electric appliance. The pictures show the short circuit current involved and also the voltage dip as a consequence. The voltage dip is logged as shown in the voltage dips and swells page.
Real Case 3
On the following images you can see voltage and frequency behavior on two different days with a blackout. Second blackout occurred one week after the first blackout.
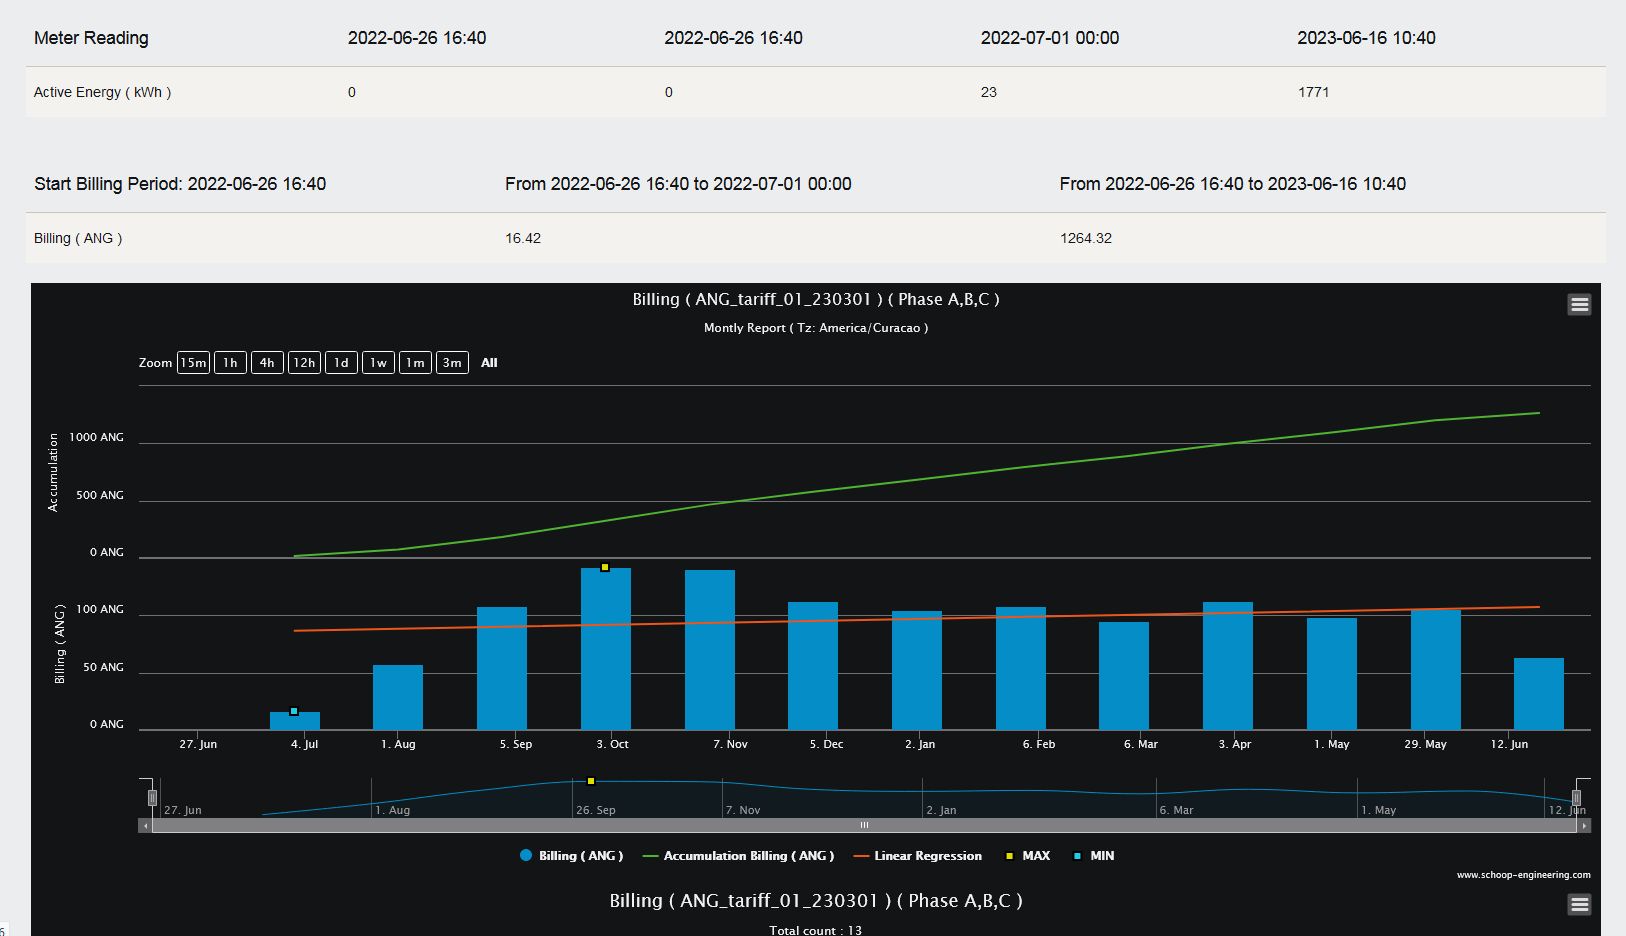
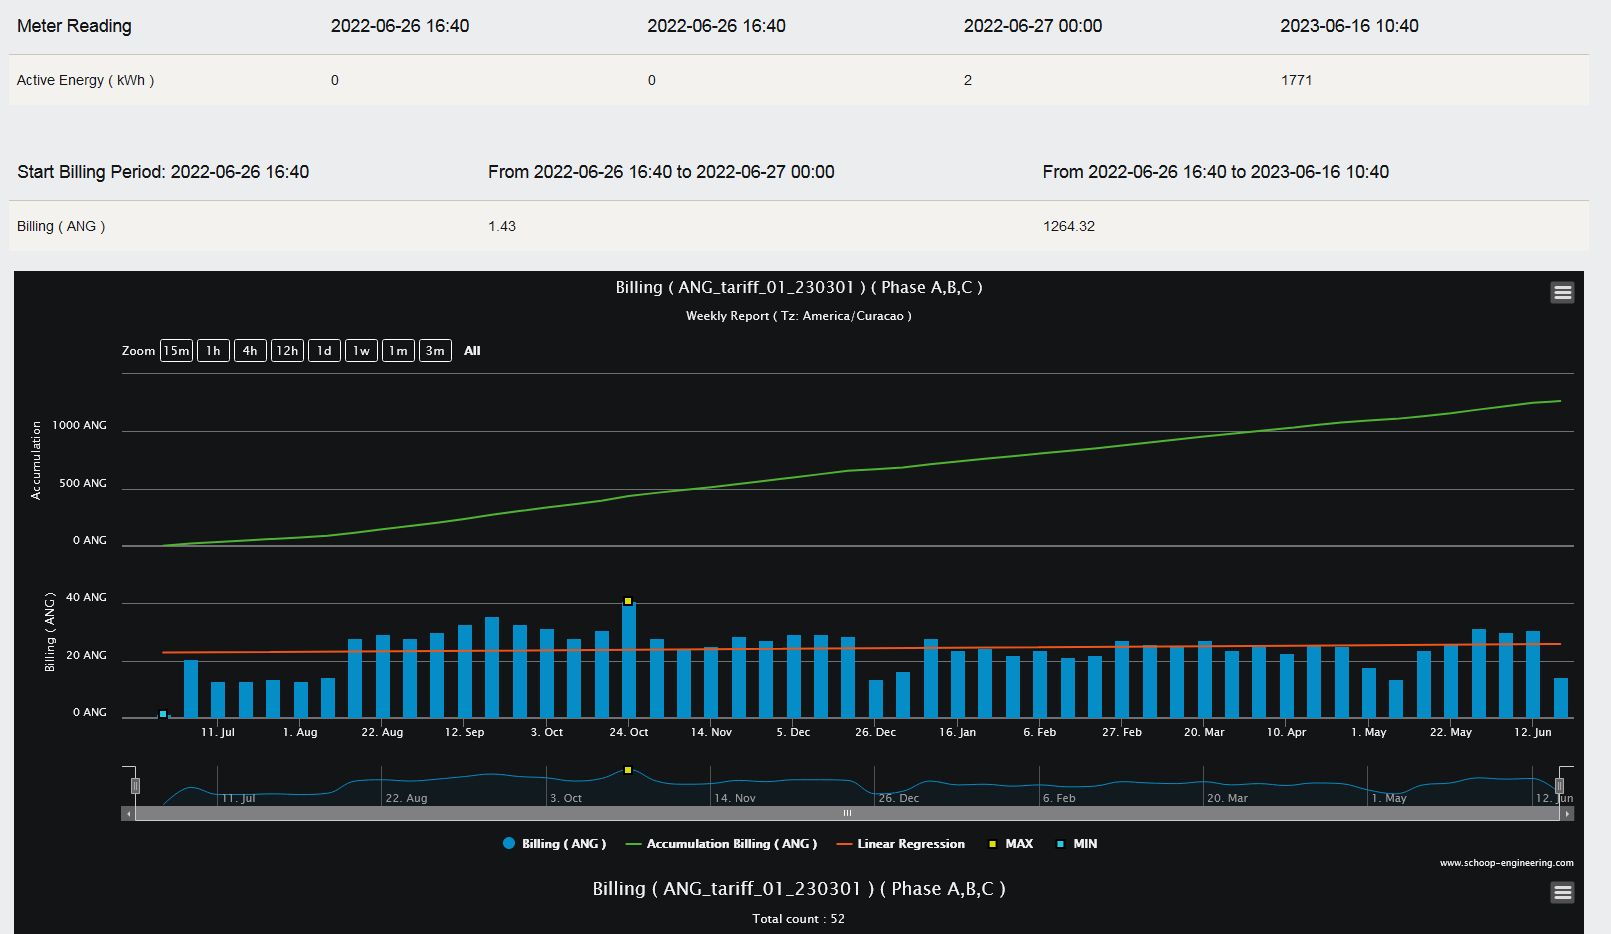
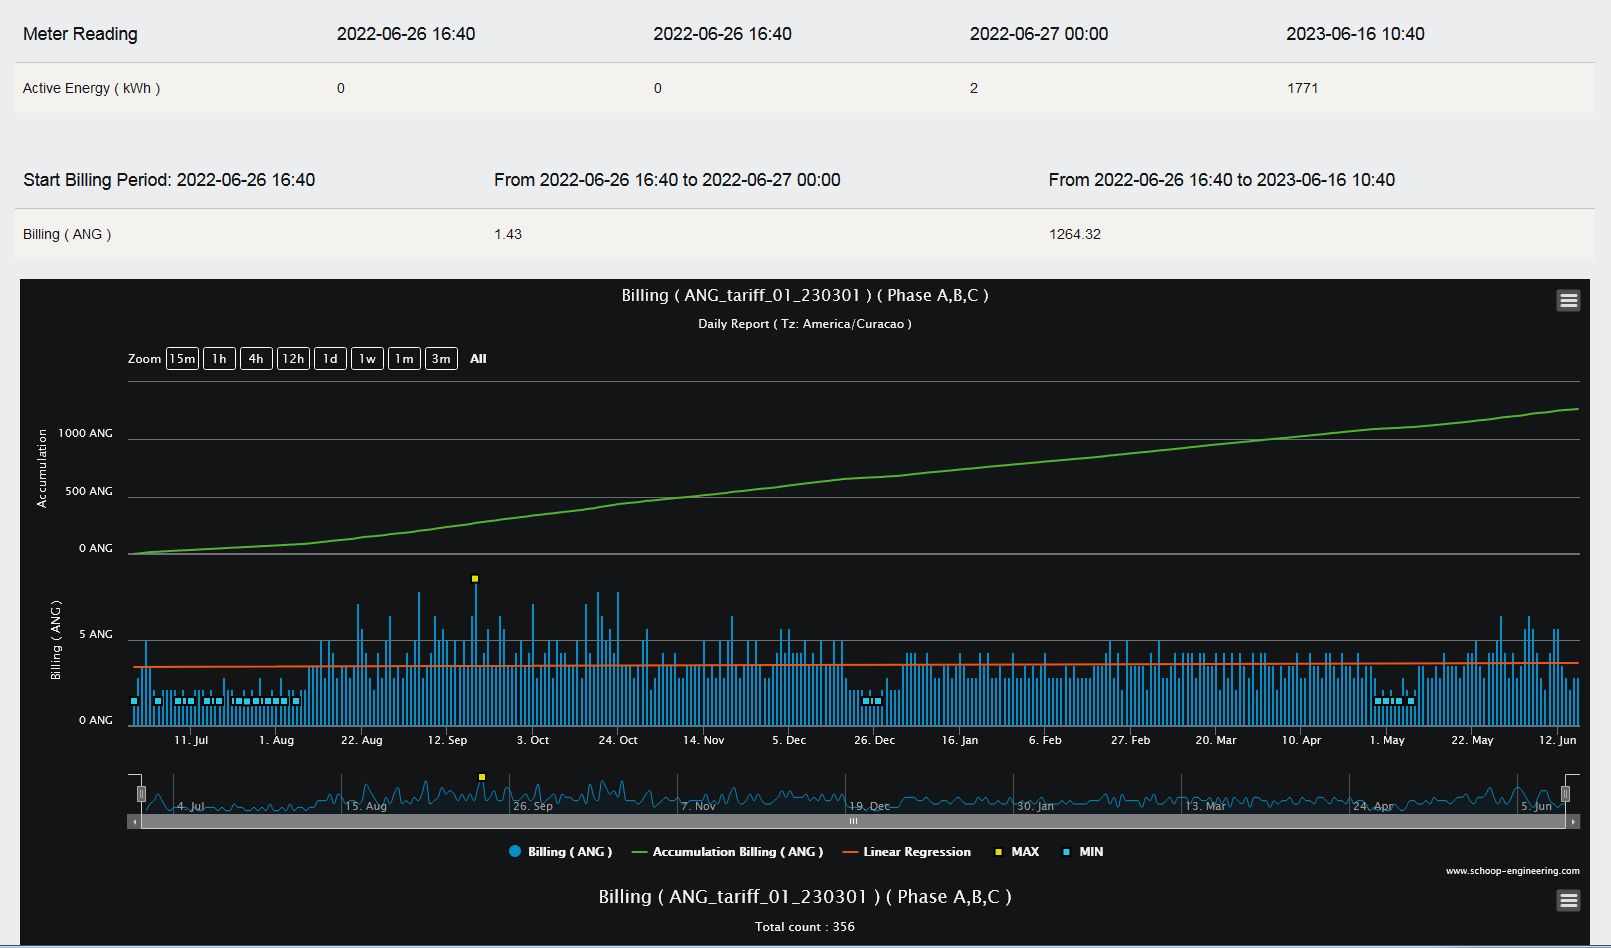
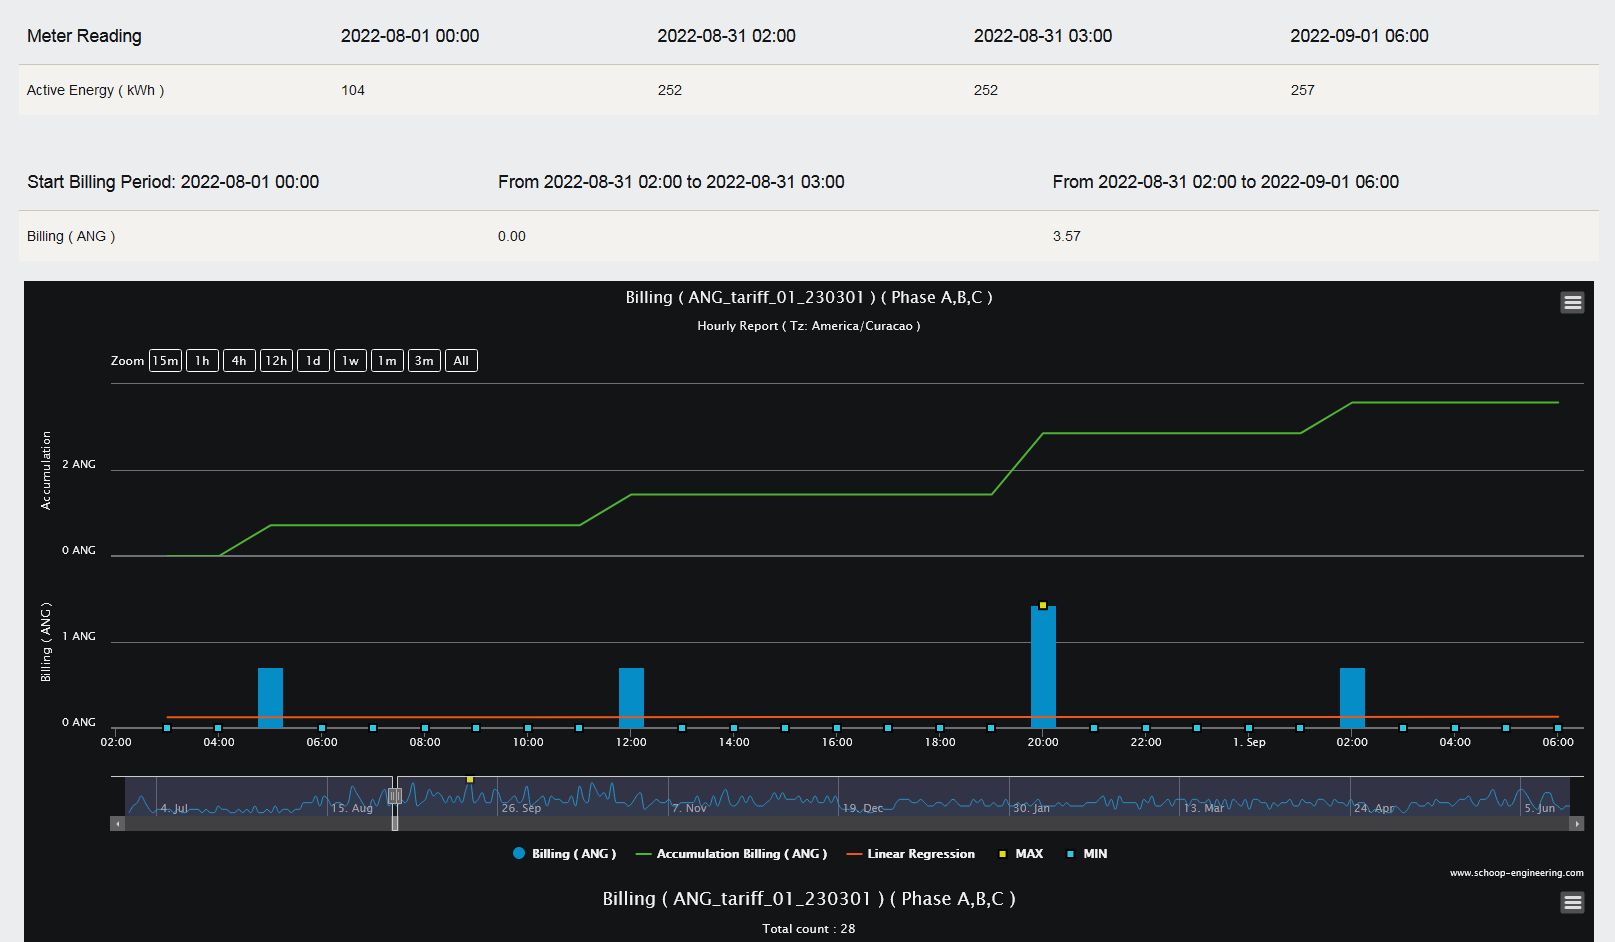
Real Case 4
The following images show analysis reports with monthly, weekly, daily and also hourly utility billing data. In the hourly reports you can see the specific time during a day when kWh energy unit ticks take place and the cost of this energy usage.
Customization Options
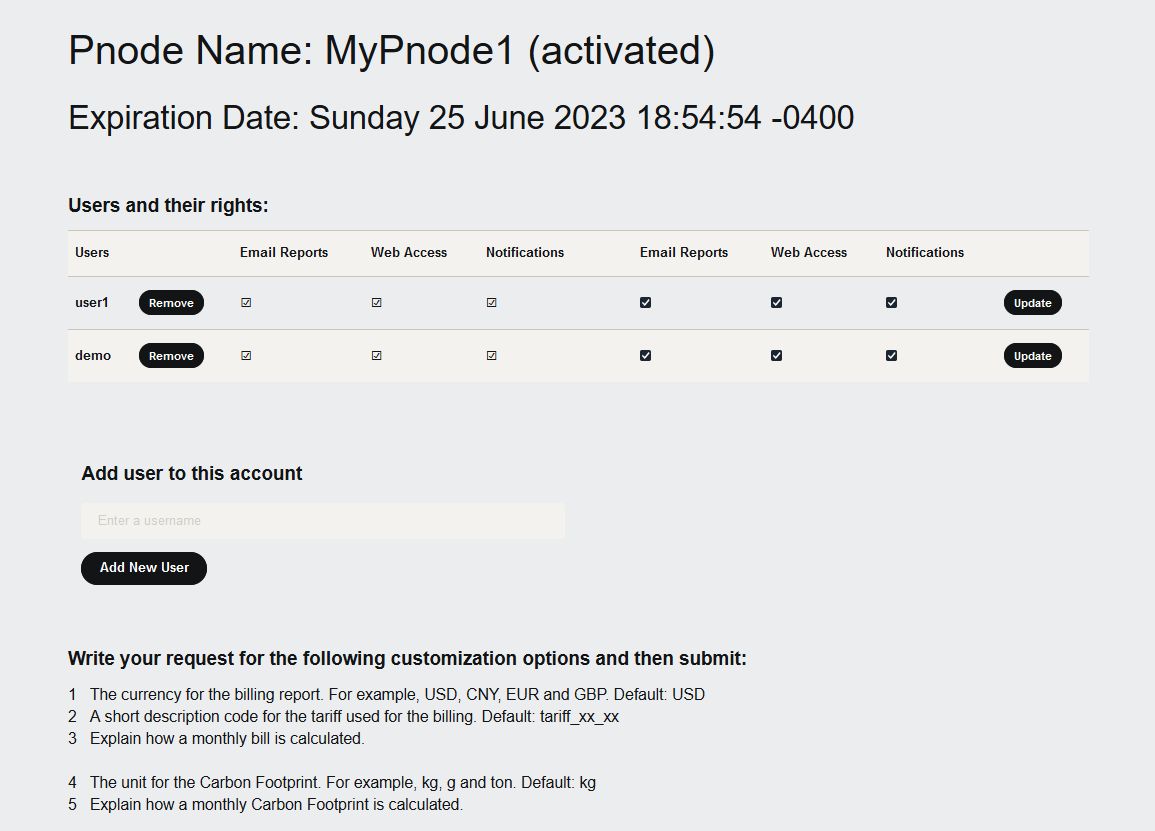
In the system administration panel, customizations are possible. Below are the customization options that are in the system administration panel:
1 The currency for the billing report. For example, USD, CNY, EUR and GBP. Default: USD
2 A short description code for the tariff used for the billing. Default: tariff_xx_xx
3 Explain how a monthly bill is calculated.
4 The unit for the Carbon Footprint. For example, kg, g and ton. Default: kg
5 Explain how a monthly Carbon Footprint is calculated.
6 The unit values for the p.u. calculations. Default: 127V, 10A, 1 kW, 1 kVA and 1 kVAR
7 The threshold for voltage dip and voltage swell detection. Default: Dip 7% and Swell 7%
8 The nominal frequency and the threshold for low and high frequency. Default: 50.0 Hz, 49.8 Hz and 50.2 Hz
9 Choose how often to receive email reports. Options are weekly, every 3 days or daily. Default: weekly
10 Give the time when the report should be generated on a day. Default is 04:00 in the morning local time.
11 If weekly reporting is chosen, also indicate the weekday to generate the report. Default is every Monday.
12 For the histograms: ranges and bin sizes for the parameters.
13 Indicate which report should be sent via email. Defaults reports are the same as in the live demo.
14 Indicate the first day of the week for the online reports. The default is Monday.
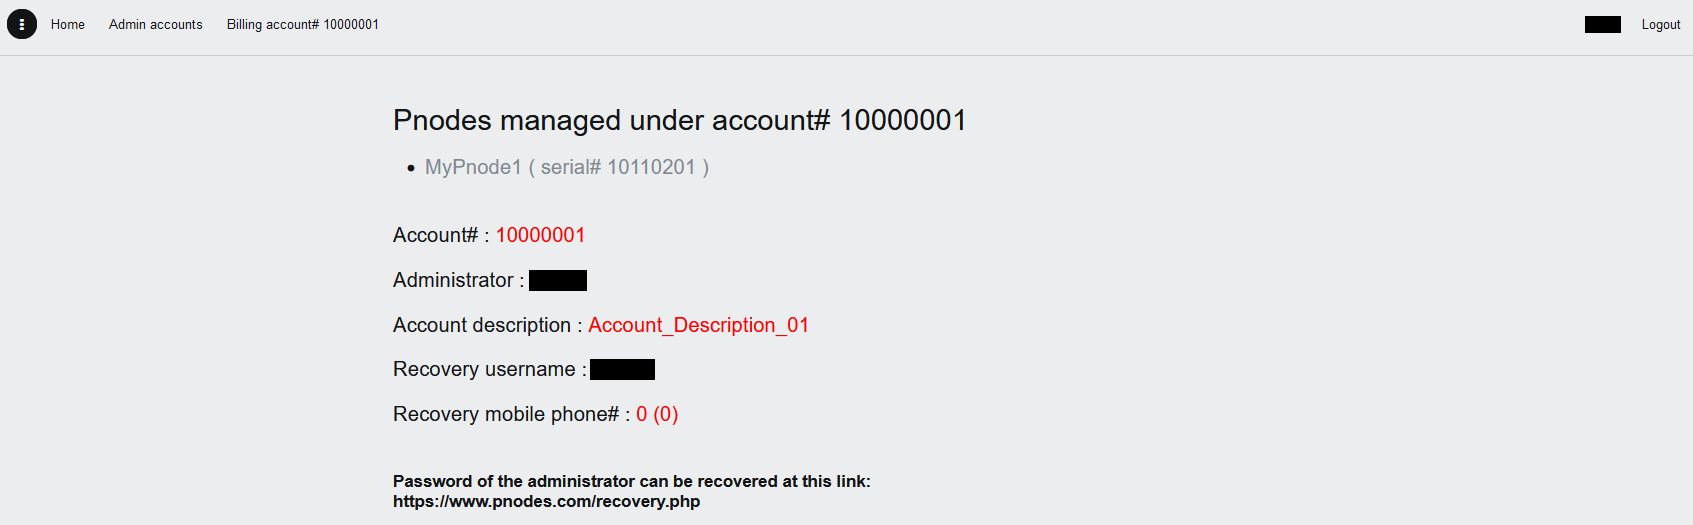
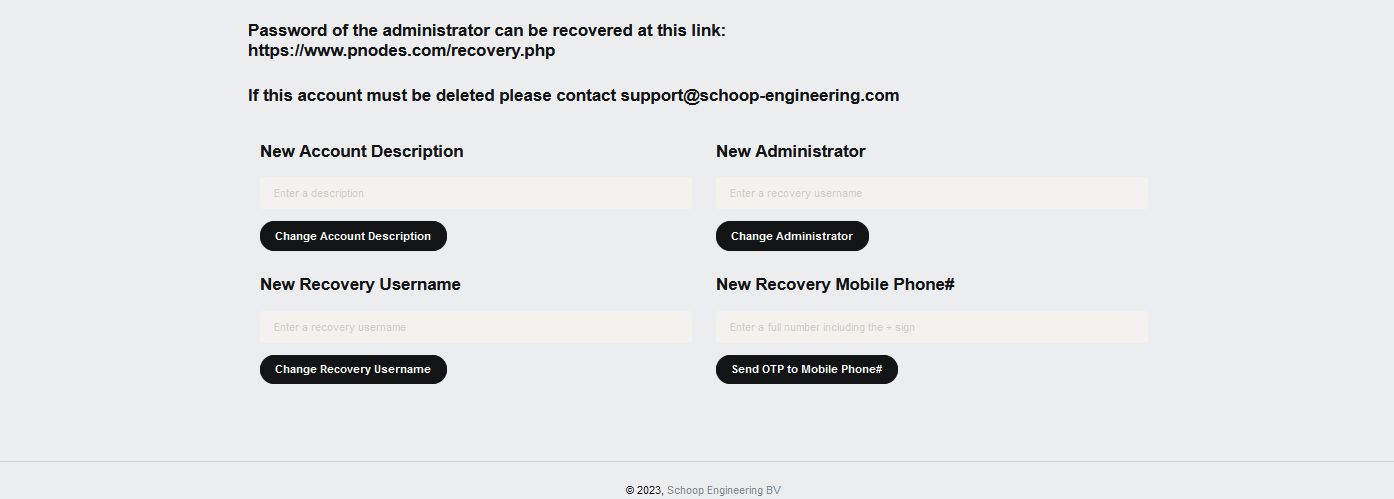
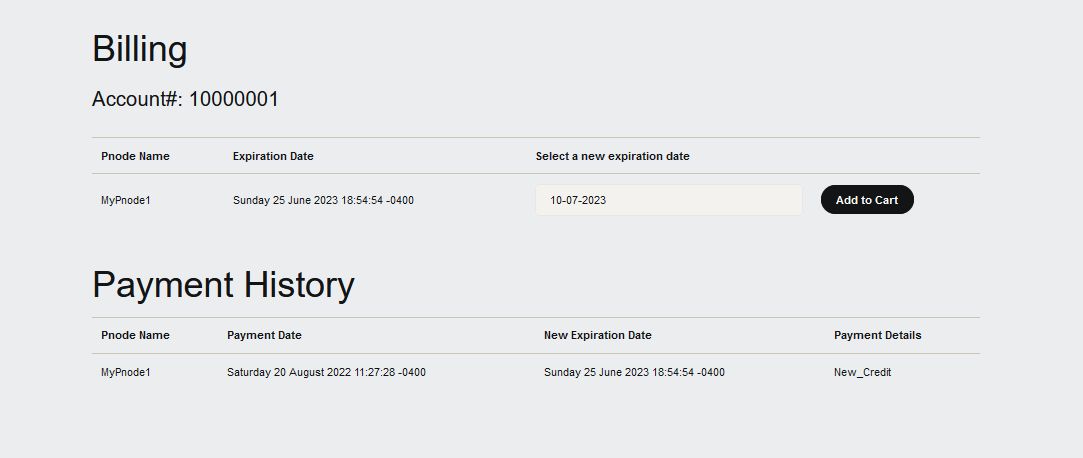
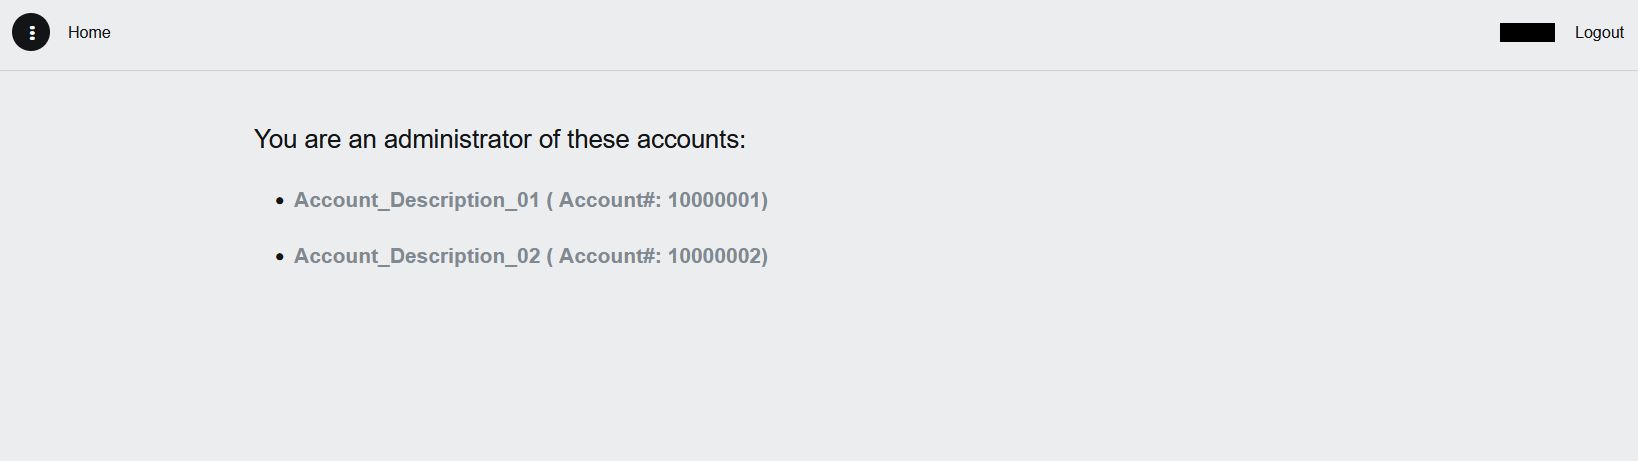
System Administration
The system administration panel is simple. The complete system administration is illustrated in the pictures below.
Besides online web access and receiving automatic email reports, users can also receive email notifications about the network performance. For example, when buffering in a PNODE reaches a certain level, notifications are sent to the users. Also, when 15 minutes has passed and no data is received from a PNODE, notification emails are sent to the users.
Besides monitoring electrical parameters, users can also monitor network performance parameters. Network engineers can act immediately when there is an issue with network connectivity.
The PNODE cloud service is available for online purchase in the system administration panel.
Contact Us
Please feel free to contact us for any questions, requests, or quotations at the email address below.